
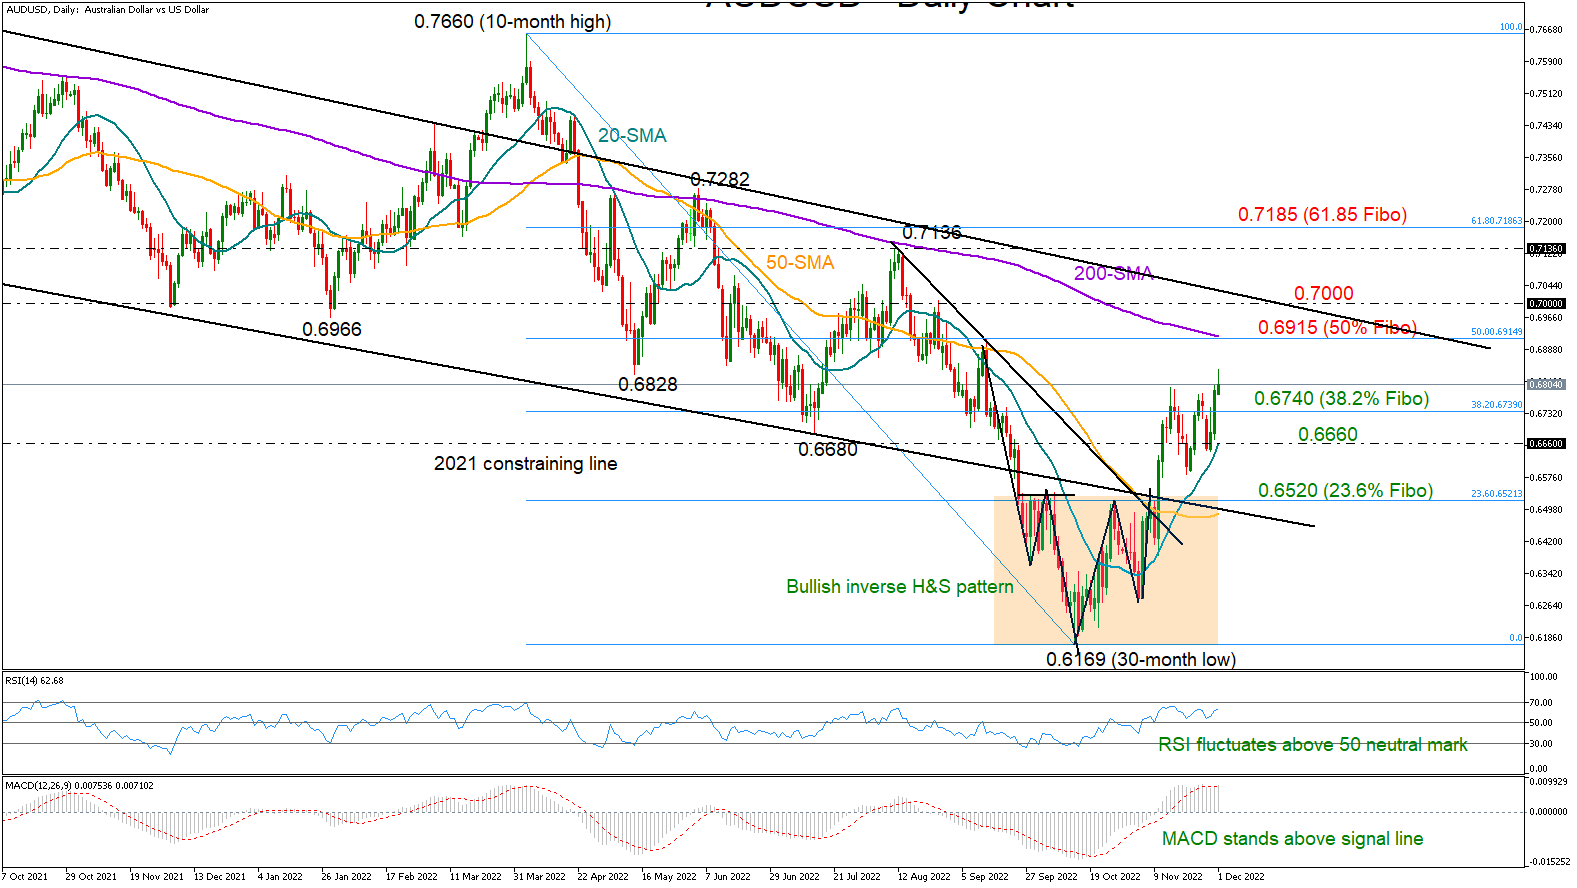
AUDUSD jumped into the 0.6800 territory early on Thursday after a remarkable session in November, which added 6% to the pair’s value—the largest gain since April 2020.
The progress followed the confirmation of a bullish inverse head and shoulders (H&S) pattern near the 30-month low of 0.6169, though the 200-day simple moving average (SMA), which has been a major obstacle to bullish actions, remains a threat at 0.6915. The 50% Fibonacci retracement of the 0.7660-0.6169 downtrend is also in the neighborhood.
Nevertheless, overbought signals haven’t been detected yet, with the RSI and the MACD feeding optimism for further recovery, as the indicators keep fluctuating comfortably within the bullish area.
Should the price advance sustainably above 0.6915, the spotlight will immediately turn to the 0.7000 psychological mark. A penetration of that barrier could provide direct access to the 0.7136–0.7185 zone, where the pair peaked in mid-August.
In the event of a bearish reversal, the 38.2% Fibonacci of 0.6740 may attract some attention ahead of the 20-day SMA, currently around 0.6660. If the latter proves fragile, the sell-off could intensify towards the 23.6% Fibonacci of 0.6520 and the 50-day SMA. Slightly lower, the long-term constraining line drawn from August 2021 could be another important area to watch.
Summarizing, AUDUSD may preserve buying interest in the short term, though whether it will overcome the crucial 200-day SMA remains to be seen. Interestingly, the monthly chart has a clear bullish doji candlestick formation, flagging more appreciation ahead.


