
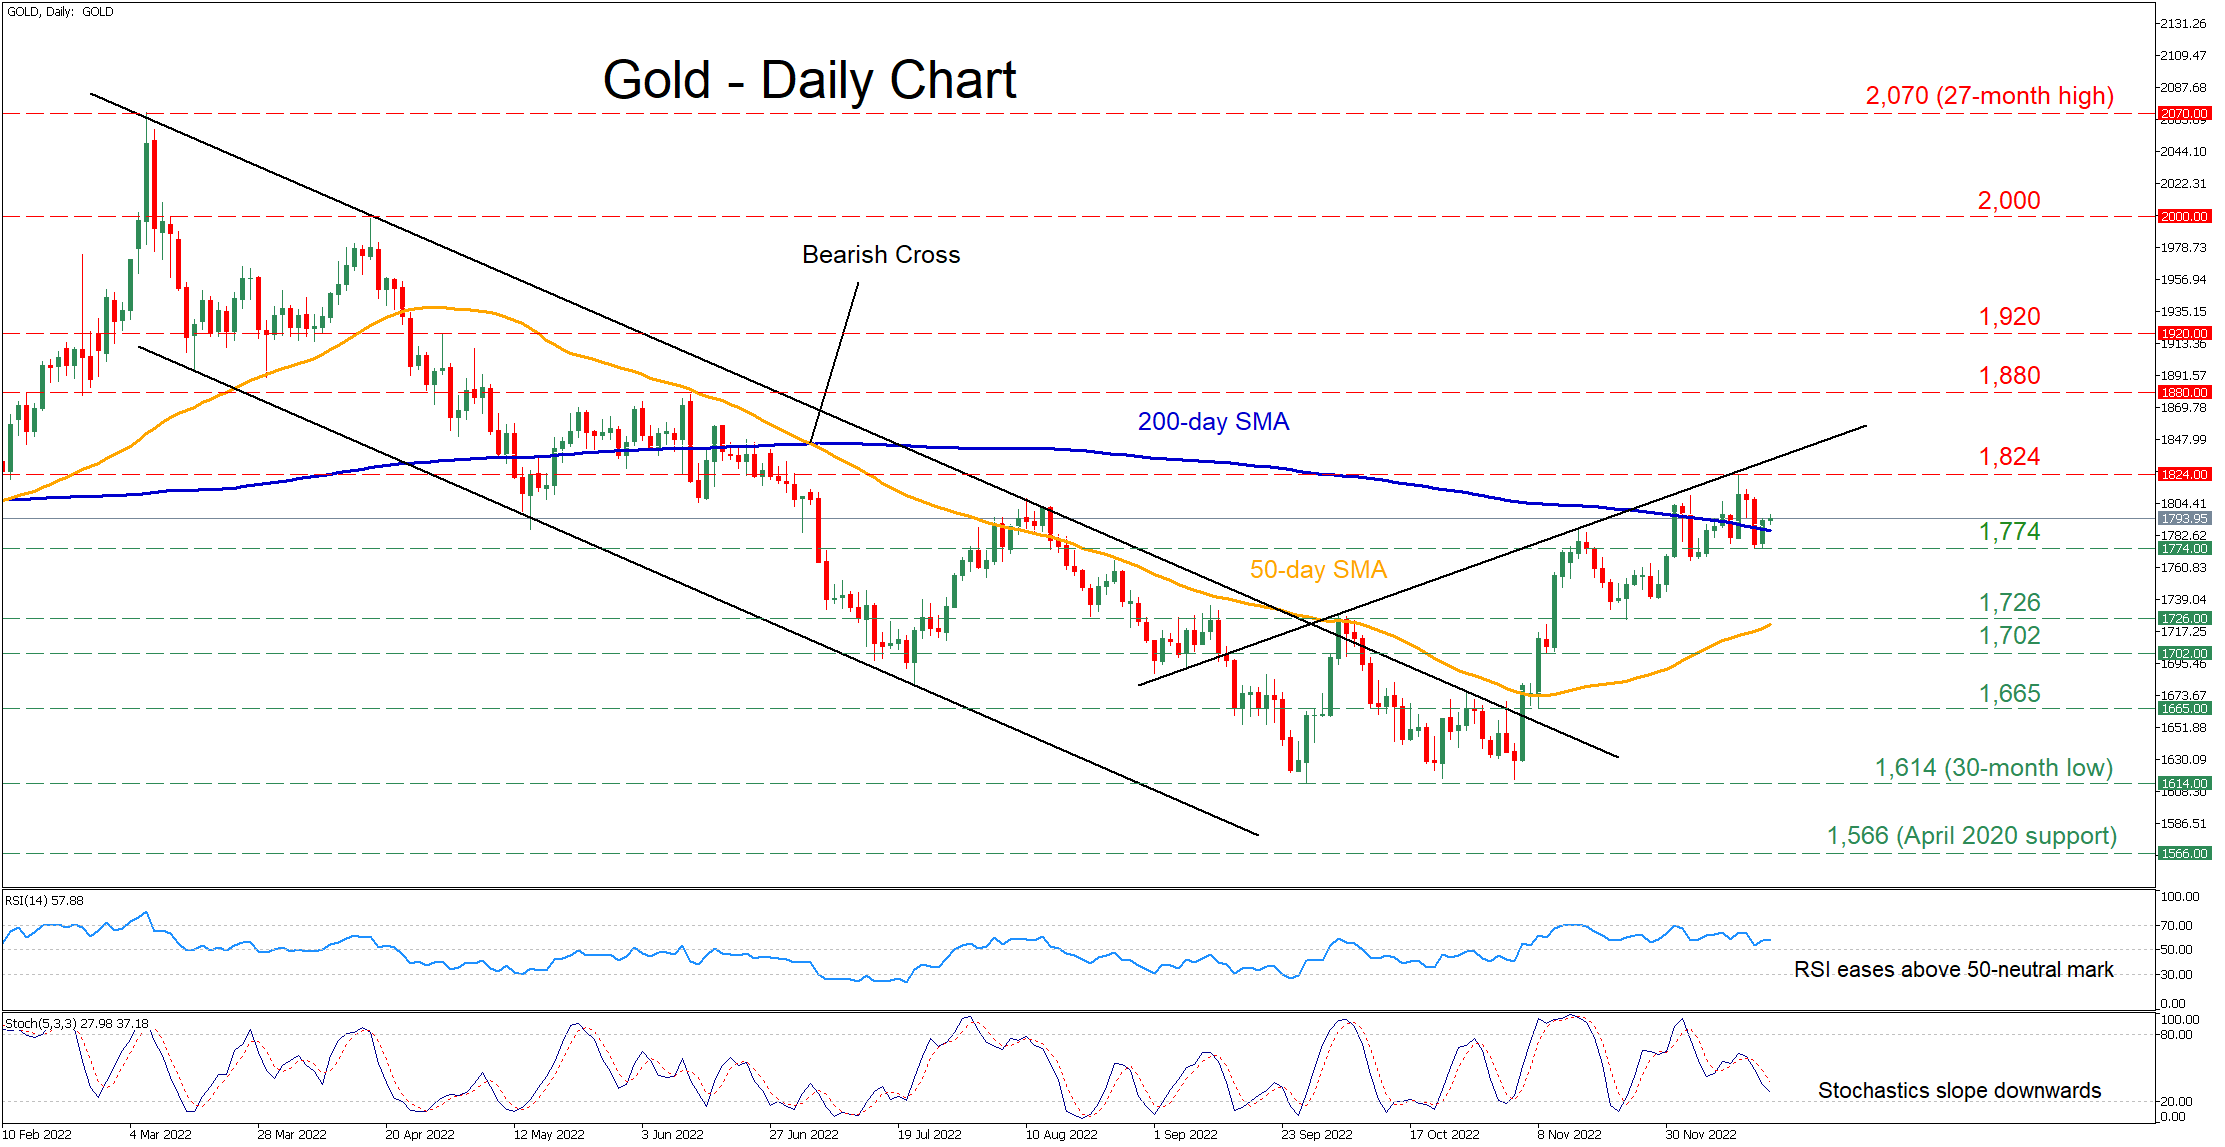
Gold had been trading within a descending channel for the most part of 2022 but managed to stage a moderate rebound since early November. Even though bullion has recovered significant ground, its recovery seems to be on hold as the price failed to profoundly surpass the 200-day simple moving average (SMA).
The fact that gold is stuck between opposing directional forces is also reinforced by the momentum indicators. Specifically, the RSI remains comfortably above its 50-neutral mark, while the stochastic oscillator is descending near the 20-oversold zone.
If sellers manage to seize control and push the price below its 200-day SMA, the recent low of 1,774 may act as the first line of defence. Breaking below that zone, the commodity could test the November support of 1,726, which lies very close to the 50-day SMA. Failing to halt there, the 1,702 barrier could prove to be a tough one for the price to violate.
Alternatively, bullish actions could propel the price towards the recent high of 1,824. If that level is breached, the bulls might aim for the June peak of 1,880. Even higher, the spotlight could turn to 1,920 before the crucial 2,000 psychological mark comes under examination.
Overall, gold’s recovery appears to be fading, while short-term oscillators fail to provide a clear directional signal. Hence, a clear break above or below the 200-day SMA could trigger a decisive move towards the same direction.


