
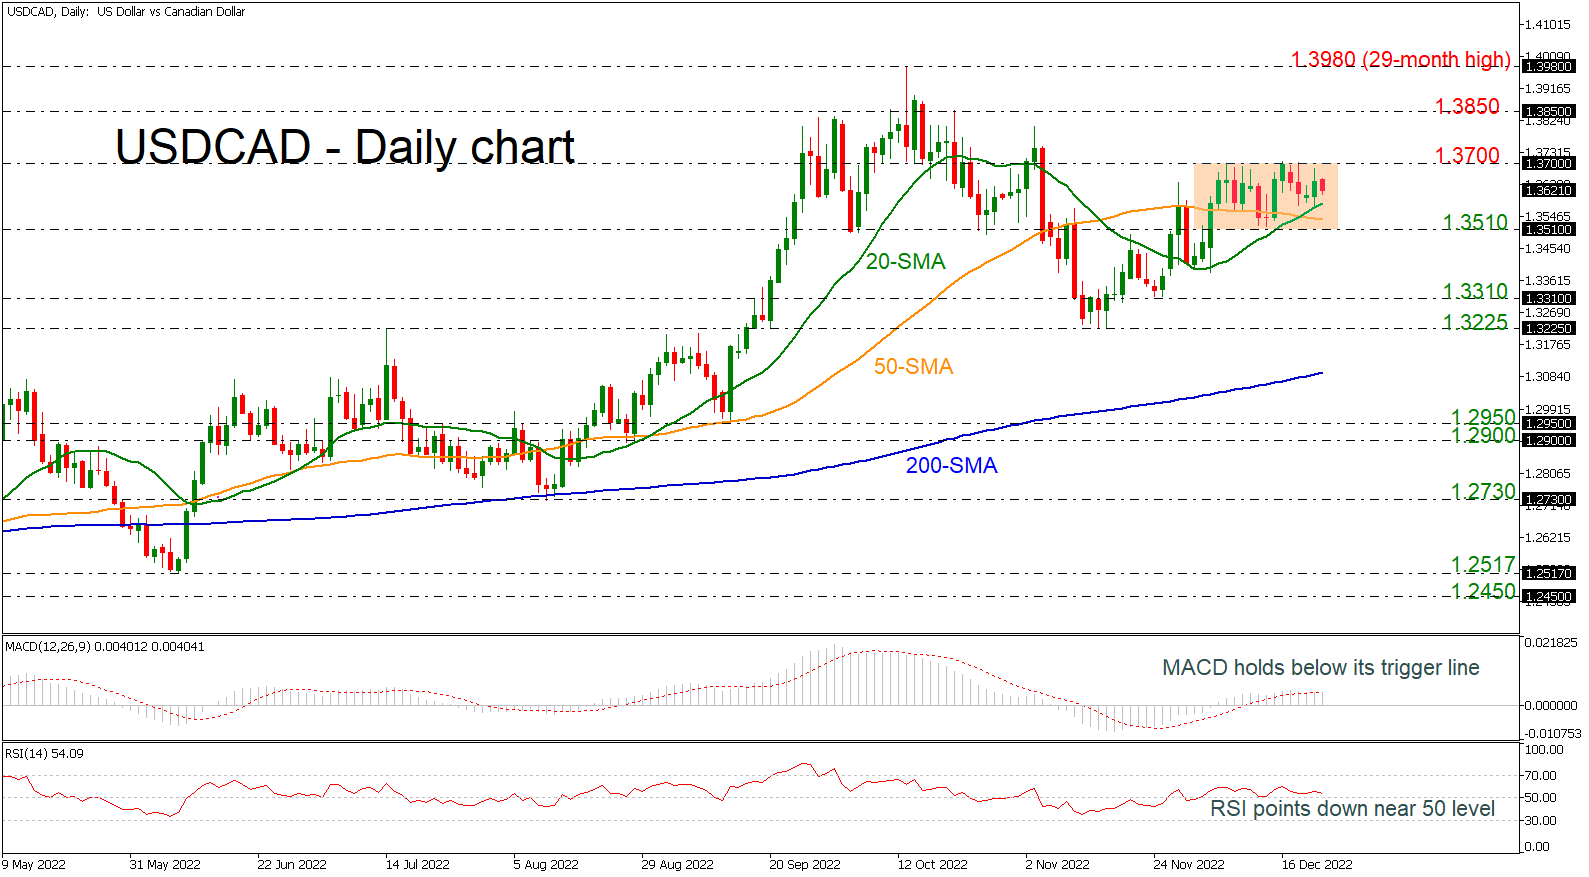
USDCAD has been moving sideways over the last three weeks within a tight range with the upper boundary at the 1.3700 psychological mark and the 1.3510 support level.
In trend indicators the 20-and 50-day simple moving average (SMAs) posted a bullish crossover, suggesting more upside moves. However, the MACD oscillator is moving sideways above the zero level, while the RSI is pointing slightly down in the positive region, indicating a weak bias.
If the market extends its gains above the 1.3700 mark, then the next barrier to have in mind is the 1.3850 resistance and the 29-month high of 1.3980, registered on October 13. Any moves above this line could endorse the long-term bullish outlook sending the market to the 1.4170 barrier, taken from the high in May 2020.
On the other hand, a drop below the short-term SMAs could open the way towards the 1.3510 support before extending the losses towards the 1.3225-1.3310 support area. Below that, the 200-day SMA at 1.3100 may halt the bearish movements.
Summarizing, USDCAD is neutral in the short-term timeframe, but in the broader outlook it is still bullish. A move beneath the 200-day SMA may change the outlook to bearish.

 Interventions?")


