
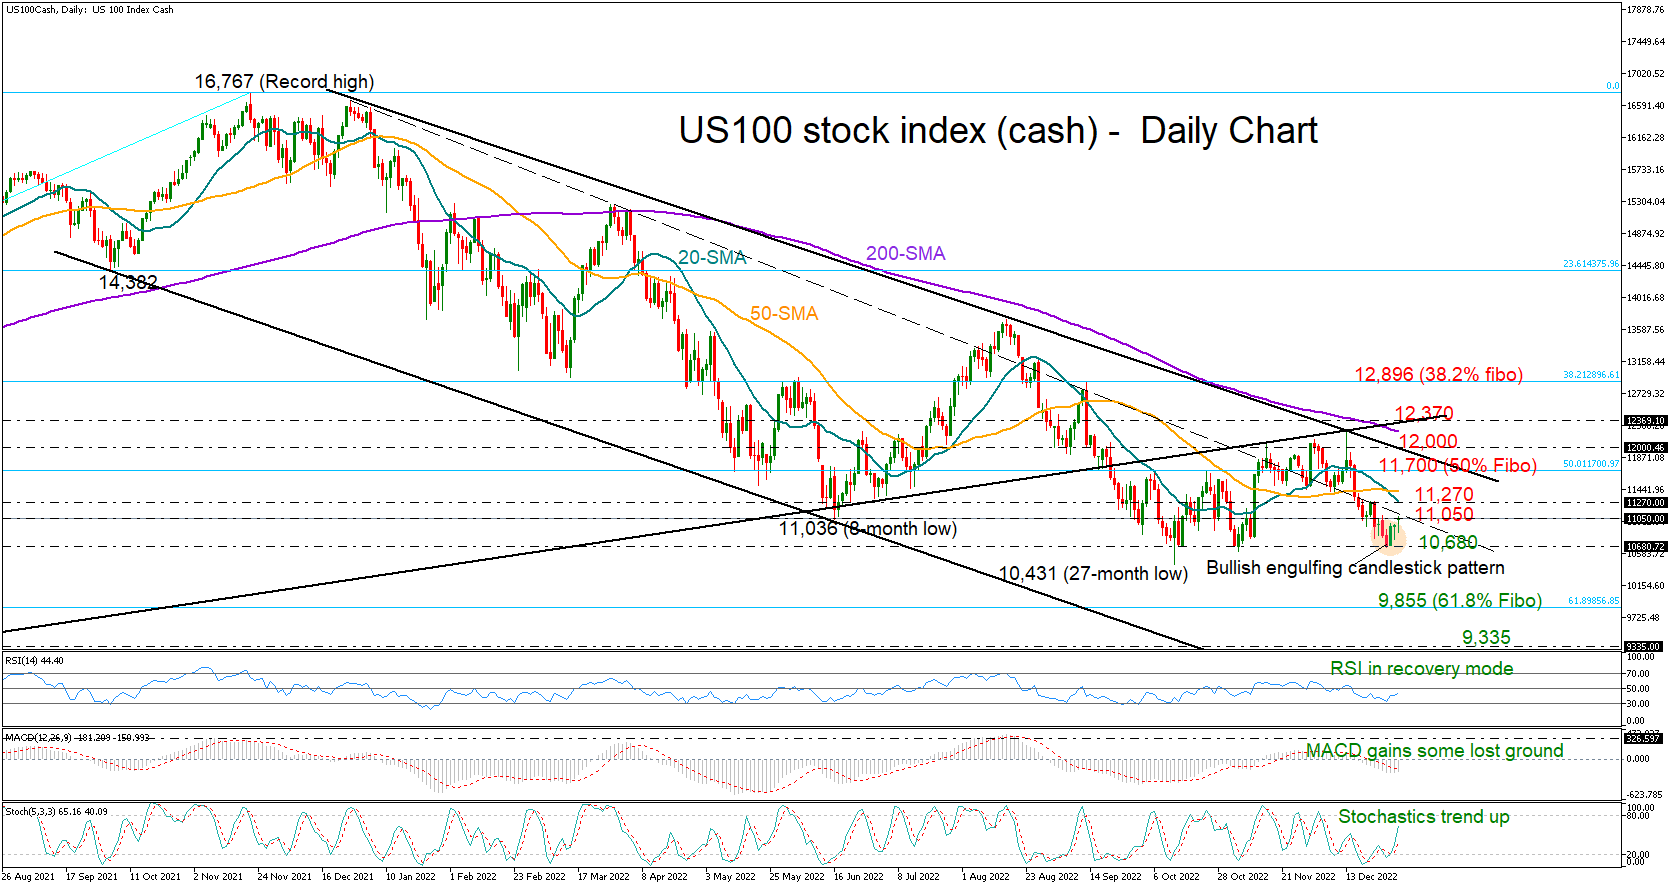
The US 100 stock index (cash) opened the new year with a gap higher at 11,050, with the bulls aiming to cross the 2022 crucial dashed trendline that resumed its resistance role last week.
The technical picture is showing signs of improvement. First of all, a triple bottom pattern seems to be in progress around 10,680, flagging a potential bullish trend reversal. In short-term signals, the positive slope in the RSI and the stochastic oscillator is an encouraging sign that upside pressures may persist during the next days, while the bullish engulfing candlestick pattern that was created last week is adding to this optimism.
There are a couple of obstacles however, which could still halt a recovery in the market. Above the dashed trendline, the 20- and 50-day simple moving averages (SMAs) could block the way towards the 50% Fibonacci retracement of the 6,634–16,767 upleg at 11,700. Slightly higher, the tough resistance trendline seen at 12,000 and the 200-day SMA will be closely watched ahead of the constraining line that ruined bullish attempts in December and November. If buyers successfully drive the market through those boundaries, the next stop could be around the 38.2% Fibonacci level of 12,896.
On the downside, a close below 10,680 could cause a brutal slide towards the 61.8% Fibonacci barrier of 9,855. If the selling interest grows further from here, some consolidation may emerge around the 9,335 barrier before the door opens for the 78.6% Fibo zone of 8,800.
In brief, the US 100 index seems to be preparing the ground for its next bullish phase, though only a decisive rally above 12,370 would confirm a positive trend reversal.


