
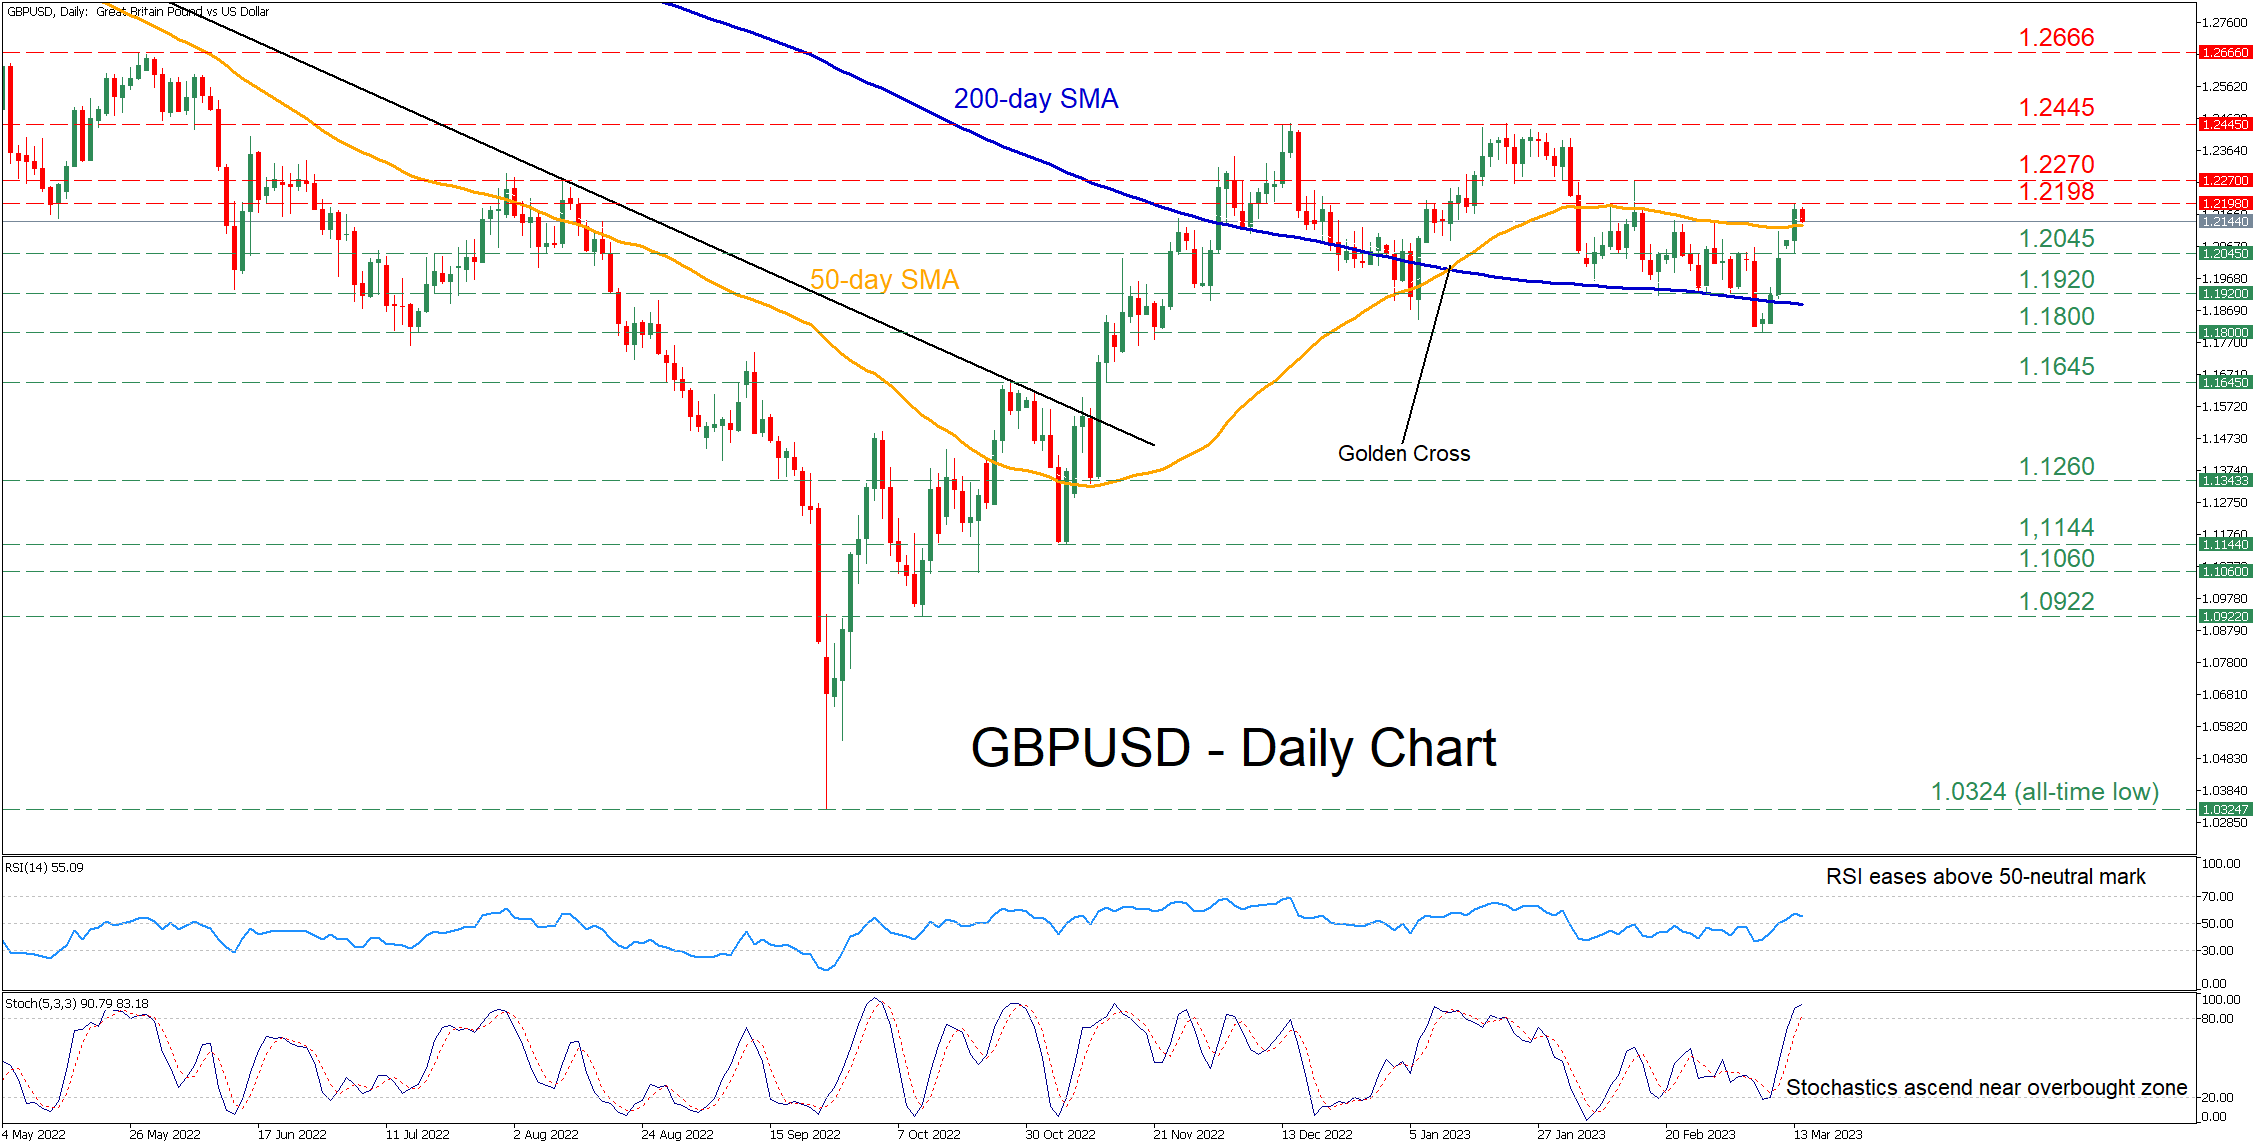
GBPUSD had been on a steady decline after its upside movement got rejected twice at the 1.2445 region. However, the pair has been gaining ground in the last few daily sessions, with the price jumping above its 50-day simple moving average (SMA) before paring some of its gains.
The momentum indicators currently suggest that near-term risks remain tilted to the upside. Specifically, the RSI has flatlined above its 50-neutral mark, while the stochastic oscillator is sloping upwards near its 80-overbought zone.
If the upside pressures persist, the pair could test the recent resistance of 1.2198. Conquering this barricade, the bulls might aim for 1.2270 before the crucial rejection zone of 1.2445 comes under examination. A break above the latter could turn the spotlight to the May high of 1.2666.
On the flipside, should the price reverse lower and dive beneath its 50-day SMA, the recent support of 1.2045 may act as the first line of defense. Sliding beneath that floor, the pair could descend towards 1.1920 or lower to test the 2023 bottom of 1.1800. If this barrier fails, further declines could cease at the October resistance of 1.1645, which could act as support in the future.
In brief, GBPUSD appears to have found traction after bouncing off its 2023 low, but the 50-day SMA has been acting as strong resistance. Hence, a clear close above this hurdle could open the door for more gains.


