
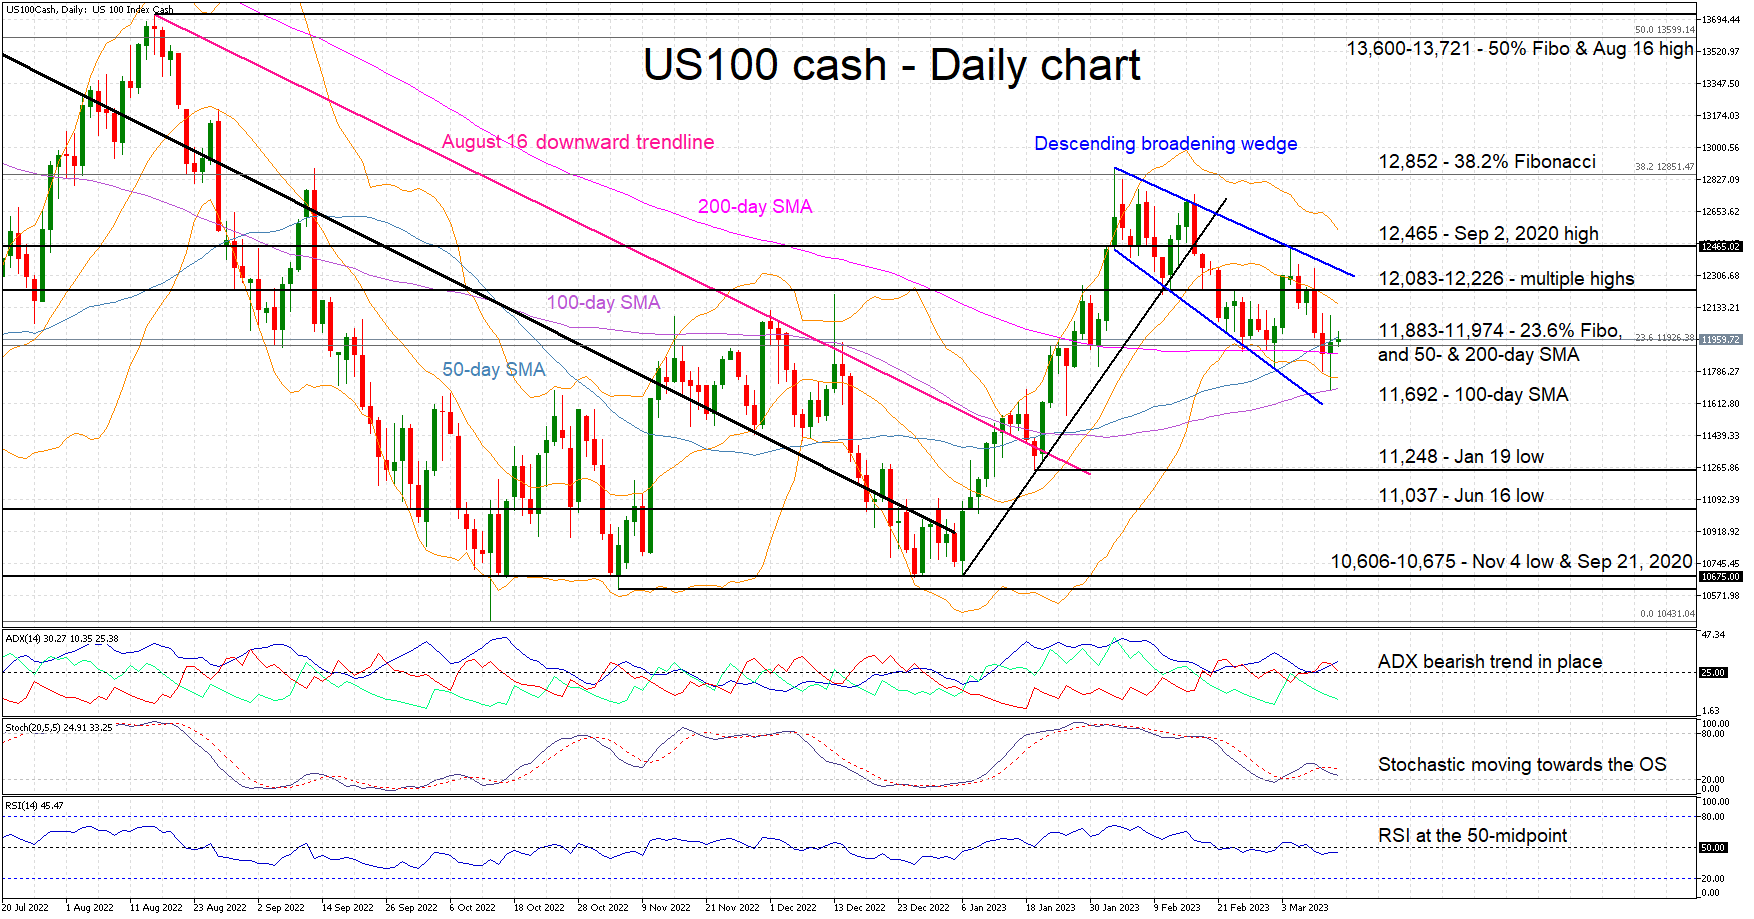
The US 100 cash index is trying to find a new balance following the recent market developments. It is currently trading above the 200-day simple moving average (SMA) and the 23.6% Fibonacci retracement level of the November 22, 2021 – October 13 downtrend. This is the second attempt from the bulls to resist the bearish pressure that is dominating market sentiment since the February 2 high of 12,894.
The bulls cannot rely on the Average Directional Movement Index (ADX) for support as this continues to signal a muted bearish trend. With the RSI hovering around its 50-midpoint, the burden once again falls on the stochastic oscillator. It is trying to drop back inside its oversold territory and potentially support another bearish move. Interestingly, a descending broadening wedge has been developing that could lend a helping hand to the bulls. This type of pattern tends to break upwards, but its performance improves significantly after a failed breakout on either side.
Should the bulls take the market reins, the first target would be at the 12,083-12,226 range set by multiple highs during 2020. Higher, the September 2, 2020 high of 12,465 could trouble the bulls before they potentially set their eyes on the 38.2% Fibonacci retracement of 12,852.
On the other hand, the first goal for the bears remains the 11,883 level set by the 200-day SMA. If successful in breaking this level, they could have a look at the 100-day SMAs at 11,692, before aiming for the January 19 low of 11,248.
To sum up, the US 100 cash index is trying to stay above the 11,883-11,974 area as the bearish pressure appears to remain well in place.


