
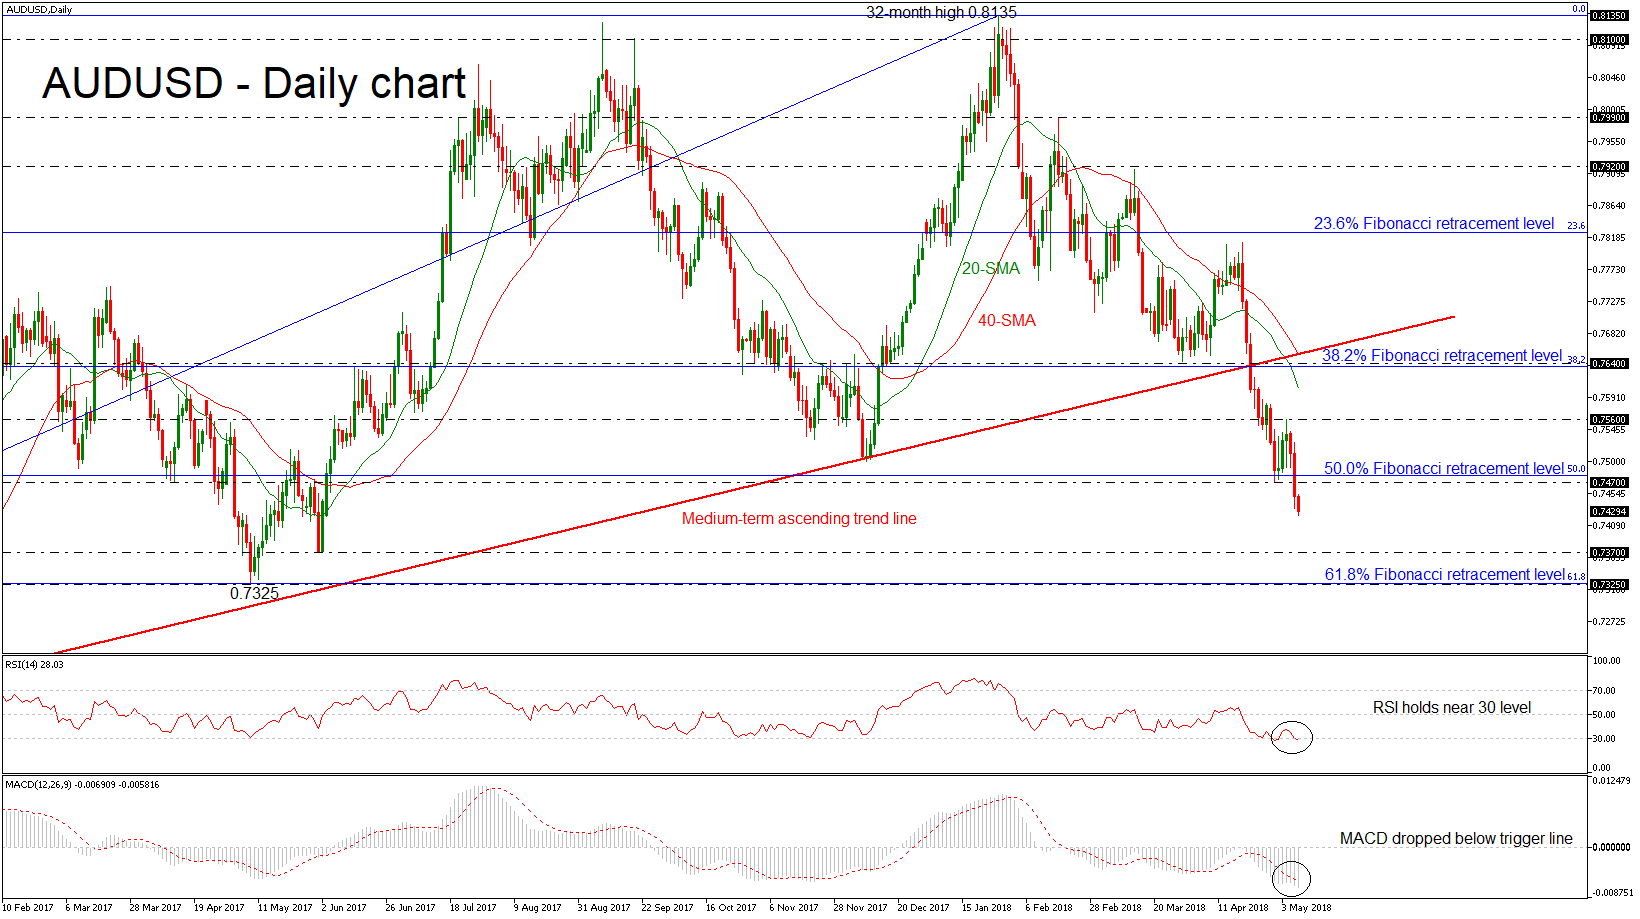
AUDUSD has come under renewed selling pressure on Wednesday, recording a fresh 11-month low of 0.7423 and remaining below the medium-term ascending trend line. This diagonal line had been holding since January 2016 and this is the third bearish week where the price has extended its losses. Despite that there was a strong support of 50.0% Fibonacci retracement level of 0.7480 of the upleg from 0.6820 to 0.8135, the price has posted an aggressive bearish rally below it once again.
More broadly, the pair has shifted the long-term bullish outlook to bearish and looking at momentum indicators in the daily timeframe, they suggest further declines may be on the cards. The Relative Strength Index (RSI) is holding slightly below its 30 level and is pointing downwards, while the MACD oscillator lies below its trigger line and is strengthening its negative momentum.
In case of further declines in the pair, immediate support may be found near the low of 0.7370 created last June. A downside break of that zone would open the way for the May 2017 bottom of 0.7325, an area that also encapsulates the 61.8% Fibonacci. If sellers manage to push below that hurdle too, that would mark a lower low in the daily timeframe, increasing the probability for further bearish extensions. Support may be found initially near 0.7160, identified by the December 2016 low.
On the flip side, if the bulls retake control and successfully surpass 0.7470, price advances may stall initially near the latest highs at 0.7560. A potential violation of the aforementioned obstacle would re-challenge the 0.7640 resistance barrier, which stands around the 38.2% Fibonacci mark. A climb above this significant area would touch the 23.6% Fibonacci of 0.7825, raising the likelihood for more advances.

 Interventions?")


