
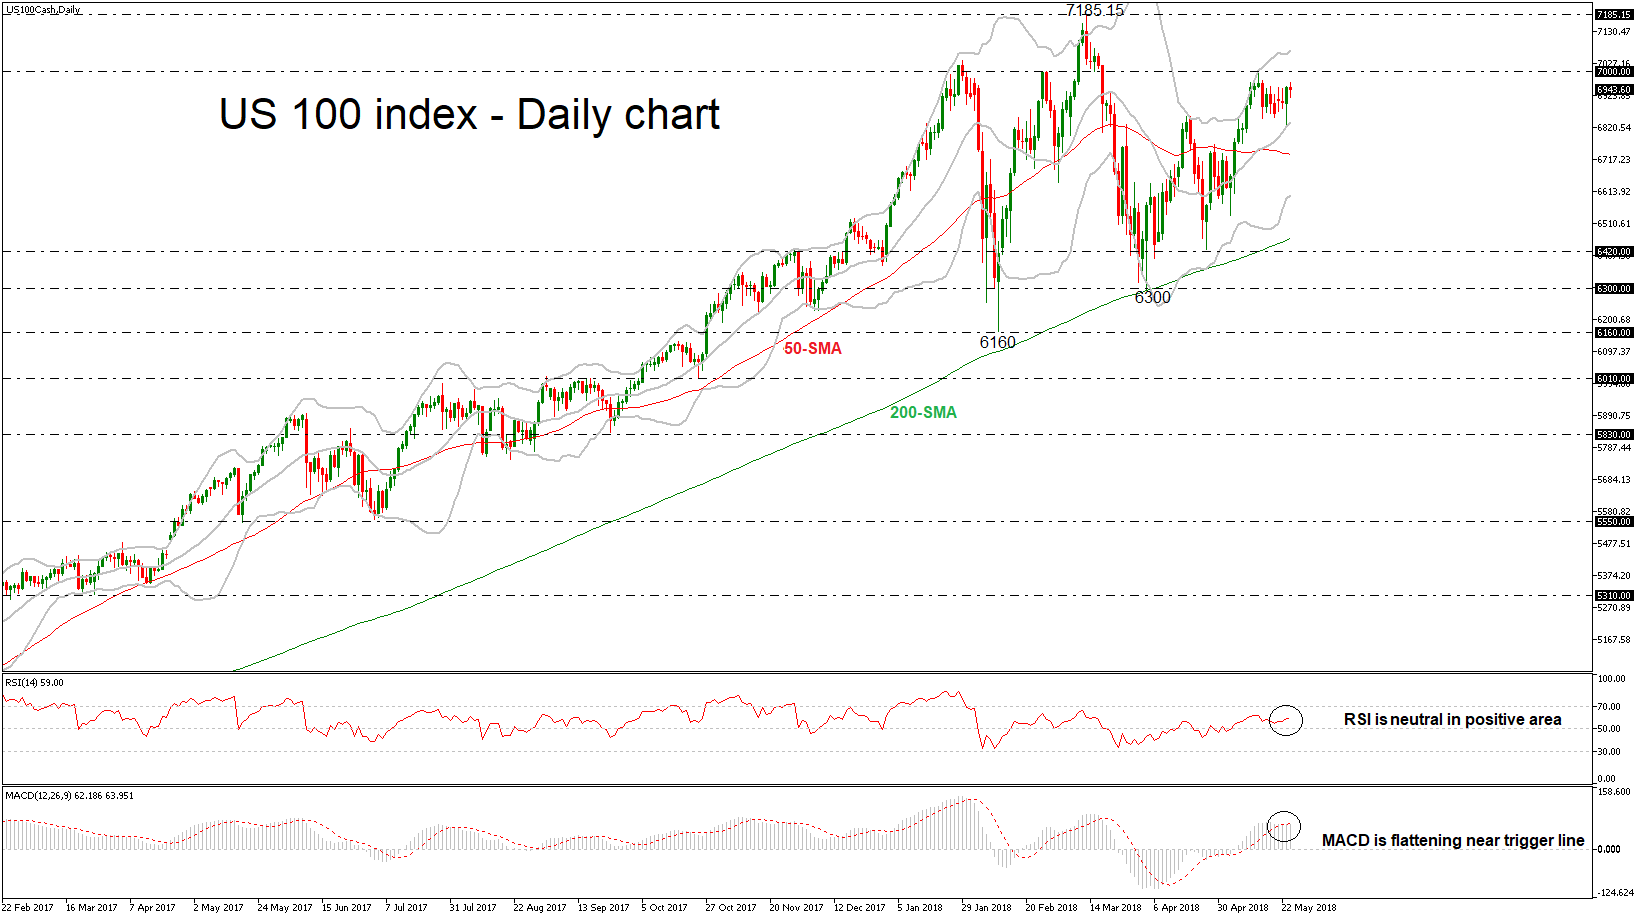
The US 100 index is moving marginally below the previous week’s high of 7,000. During yesterday’s session, the price rebounded on the middle Bollinger line (this being a 20-day simple moving average one) and is still developing well above the 50- and 200-day SMAs, suggesting an extension of the bullish tendency.
However, the RSI indicator seems to be somewhat halting its advance, hinting to a possible change in short-term dynamics from bullish to bearish. Turning to the MACD oscillator, in the short-term chart, it is giving neutral signals as it is flattening in the positive territory.
Should the index extend its gains, the next level to have in mind is the 7,000 psychological resistance level. A jump above this area would endorse the bullish bias and start to increasingly challenge the 7,185.15 record high, achieved on March 13.
On the downside, the price could touch the 50-day SMA near 6,733 before being able to slip towards the lower Bollinger Band around 6,600. The 6,420 barrier which was violated in the past may offer support on the way down as well.
Overall, there are bearish signals in the short-term, while the medium-term picture is still bullish, with price action taking place above both the 50- and 200-SMAs.


