
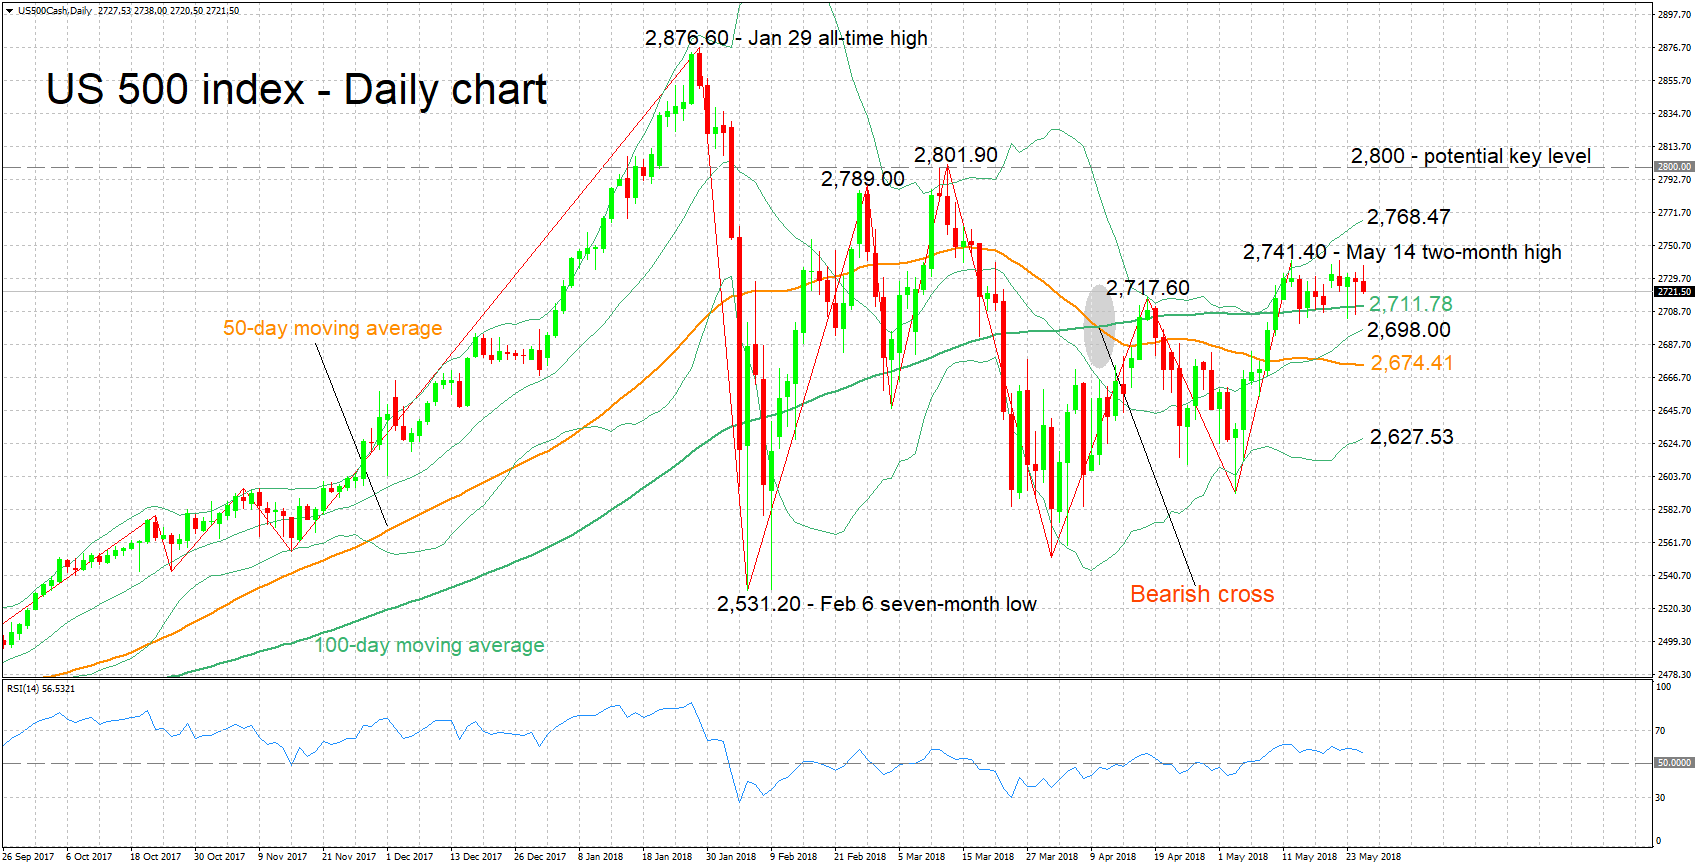
The US 500 index is trading not far below May 14’s two-month high of 2,741.40. Throughout the last couple of weeks the index has been largely moving sideways.
The RSI, which has also been moving sideways to a large extent recently, is painting a mostly neutral picture in the short-term.
Immediate resistance to advances may be coming around May 14’s two-month high of 2,741.40. The upper Bollinger band lies not far above at 2,768.47, while a move off and to the upside of this level would turn the attention to the region around the 2,800 figure, which encapsulates a couple of peaks from previous months (at 2,789.00 and 2,801.90) and may hold psychological importance.
On the downside, support could be met at the region around the current level of the 100-day moving average at 2,711.78, which includes a recent top (2,717.60), as well as the 2,700 handle and the middle Bollinger line (2,698.00) – the latter is a 20-day MA line. The 50-day MA is not far below at 2,674.41, while in case of steeper losses the focus would start to increasingly shift to the lower Bollinger band at 2,627.53.
In terms of the medium-term picture, price action seems to challenge the negative signal given by the bearish cross recorded in early April when the 50-day MA moved below the 100-day one. Specifically, trading activity taking place above both the 50- and 100-day MA lines – but not far above the latter – is giving a cautiously bullish medium-term picture. A drop below the 100-day MA (2,711.78) would tilt the outlook more towards neutrality.
Overall, the short-term bias is looking neutral and the medium-term outlook is moderately bullish at the moment.


