
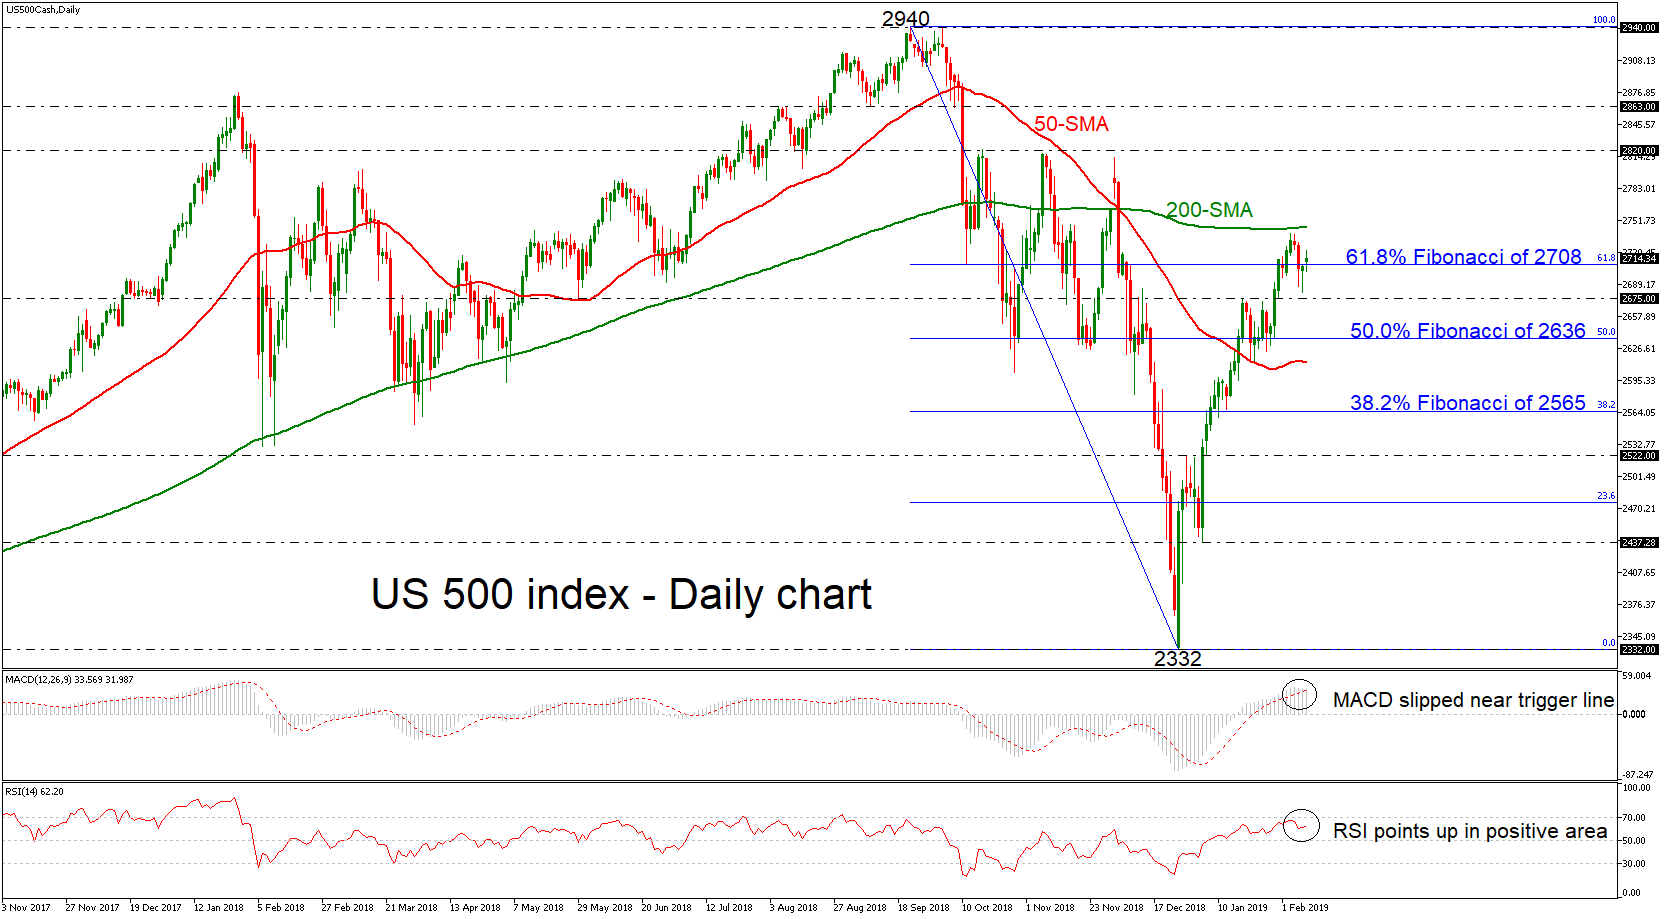
US 30 stock index found strong resistance obstacle at the 200-simple moving average (SMA) in the daily timeframe, hovering around the 61.8% Fibonacci retracement level of the downleg from 2,940 to 2,332, near 2,708. The short-term technical indicators support this notion as the RSI is marginally pointing upwards in the positive area, while the MACD lies near the trigger and zero lines.
A fresh wave of advances may stall initially near the 200-SMA, but a successful jump above this key level would increase chances for a touch of the 2,820 resistance level, switching the neutral outlook to a more bullish one in the short-term. A significant leg above this region would open the way towards the next barrier of 2,863.
On the downside, support to further bearish actions may come around the 2675 level, taken from the inside swing top on January 18. Even steeper bearish extensions may encounter support around the 50.0% Fibonacci mark of 2,636.
Overall, the US 500 index is in progress of a bullish correction and this action would be confirmed in case of a daily close above 200-SMA.


