
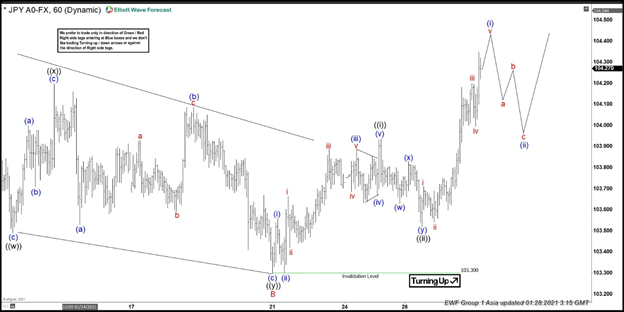
Short Term Elliott Wave View in USDJPY suggests the rally from January 6 low is unfolding as a zigzag Elliott Wave structure. Up from January 6 low, wave A ended at 104.39 and wave B pullback ended at 103.3. The 1 hour chart below shows the wave B pullback. The internal subdivision of wave B unfolded as a double three Elliott Wave structure. Down from wave A, wave ((w)) ended at 103.49 and bounce in wave ((x)) ended at 104.198. Pair then ended wave ((y)) of B at 103.3.
The pair has turned higher in wave C. It has broken above wave A at 104.39 suggesting the next leg higher has started. Up from wave B, wave ((i)) ended at 103.937, and wave ((ii)) pullback ended at 103.52. Pair then resumes higher in wave ((iii)) as a nest. Expect pair to end wave (i) of ((iii)) soon, then it should pullback in wave (ii) to correct cycle from January 26 low before the rally resumes. As far as pivot at 103.3 low remains intact, expect dips to find support in 3, 7, or 11 swing for further upside. Potential target higher is 100% – 123.6% Fibonacci extension from January 6 low which comes at 105.1 – 106.2.
USD/JPY 60 Minutes Elliott Wave Chart


