
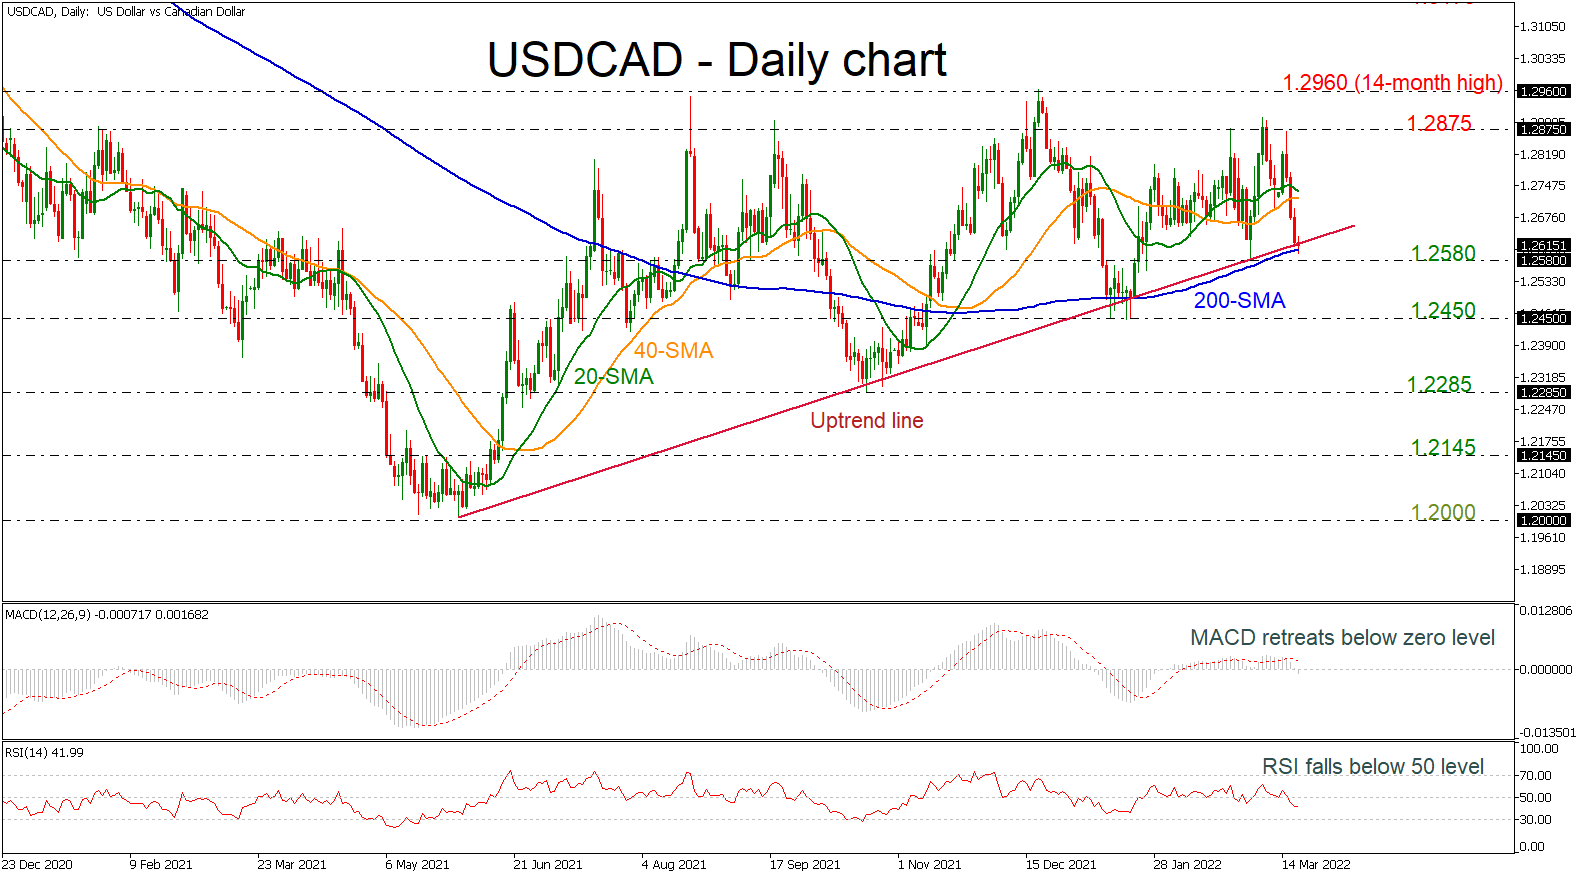
USDCAD is currently challenging the long-term ascending trend line and the 200-day simple moving average (SMA) around the 1.2600 psychological mark. The price is showing some signs that it would be a penetration of the diagonal line, suggesting the start of a neutral outlook.
According to the technical indicators, the MACD oscillator dived beneath its zero line, strengthening its momentum below trigger line, while the RSI is falling below the neutral threshold of 50. The 20- and 40-day SMAs are ready for a bearish crossover, confirming the recent move.
In case the pair changes its direction to the downside, the bears will probably challenge the previous bottom at 1.2580. A break lower, could last until 1.2450 before moving lower towards the 1.2285 support, taken from the low in October 2021.
Alternatively, a rebound off the uptrend line may drive the price towards the 20- and 40-day SMAs at 1.2730. Above the latter, the 1.2875 resistance, which rejected the market’s actions recently could be another level in focus ahead of the 14-month high of 1.2960.
Summarizing, USDCAD maintains a bearish phase in the short-term picture, and if there is a successful drop beneath the rising trend line it could change the long-term outlook to negative as well.

 Interventions?")


