
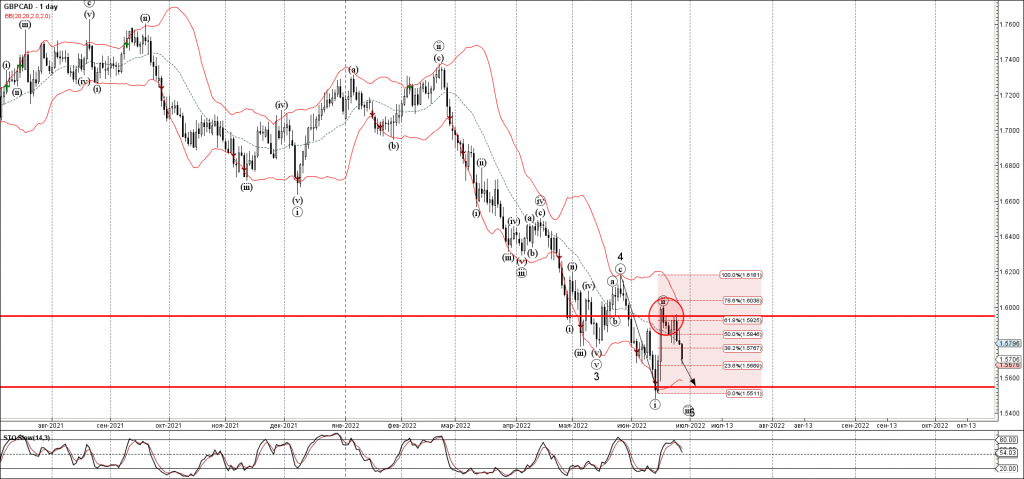
- GBPCAD falling inside impulse wave (iii)
- Likely to fall to support level 1.5550
GBPCAD continues to fall inside the short-term downward impulse wave (iii), which started recently from the resistance area located between the resistance level 1.5950, upper daily Bollinger Band and the 61.8% Fibonacci correction of the downward impulse (i) from May.
The downward reversal from this resistance area started the active minor impulse wave (iii).
Given the strong daily downtrend, GBPCAD can be expected to fall further toward the next support level 1.5550 (which stopped the earlier sharp downward impulse wave (i)).


