
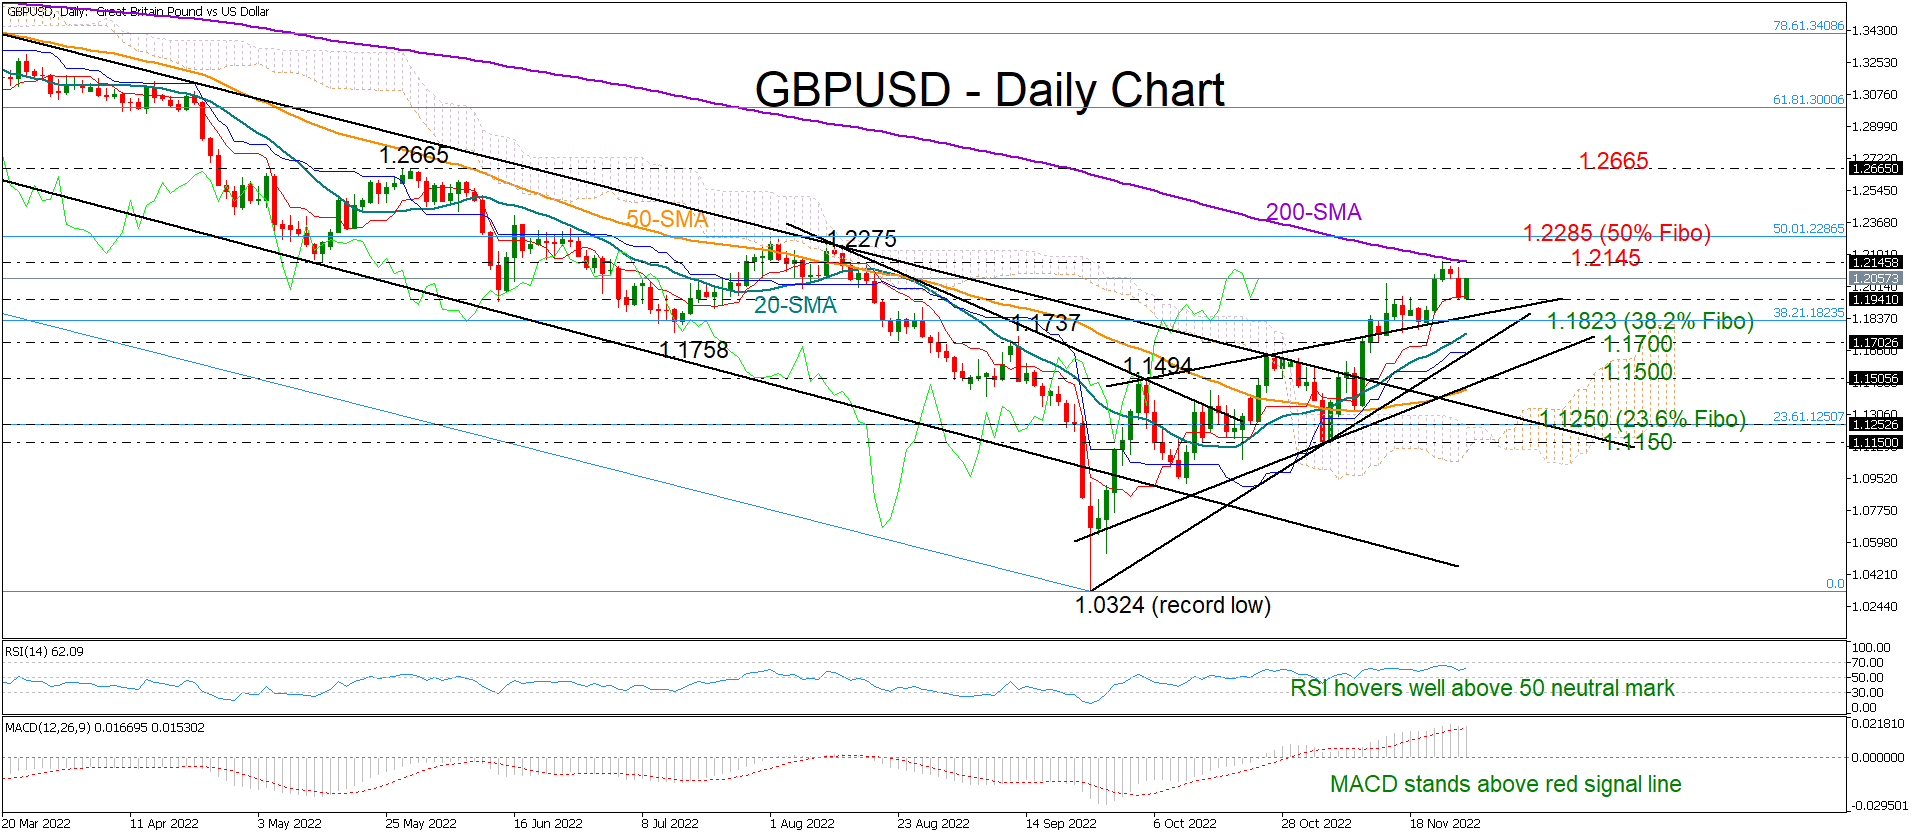
GBPUSD finished Monday’s session on the negative side, unable to climb above the 200-day simple moving average (SMA) at 1.2145 once again; the line has been acting as a crucial ceiling to upside movements since September 2021.
The positive structure of higher highs and higher lows in the short-term picture remains valid, backed by the bullish cross between the 20- and 50-day SMAs.
Encouragingly, the momentum indicators are still in favor of the bulls despite the latest retreat in the price. The RSI is maintaining a positive trajectory above its 50 neutral mark and the MACD is standing above its red signal and zero lines. Adding to the optimism is the flattening red Tenkan-sen line, which is fluctuating some distance above the blue Kijun-sen line.
Support is currently provided by the red Tenkan-sen line at 1.1940, where the 50-period SMA is positioned in the four-hour chart. If that base stands firm, the pair may again challenge the 200-day SMA with scope to reach the 50% Fibonacci retracement of the 1.4248–1.0324 downleg at 1.2285. The area has been a key resistance zone during the second half of 2022. Therefore, a sustainable move above that wall could renew bullish pressures, sparking a rally towards the next barrier of 1.2665.
On the downside, the 1.1823–1.1700 zone, which encapsulates two constraining lines, the 20-day SMA, and the 38.2% Fibonacci, may limit selling pressures. If not, the lower ascending trendline currently at 1.1500 may prevent an outlook deterioration and an aggressive decline towards the 1.1250–1.1150 support area.
In brief, GBPUSD keeps trading within a bullish region, though only an advance above the 200-day SMA would bring new buyers into the market.


