
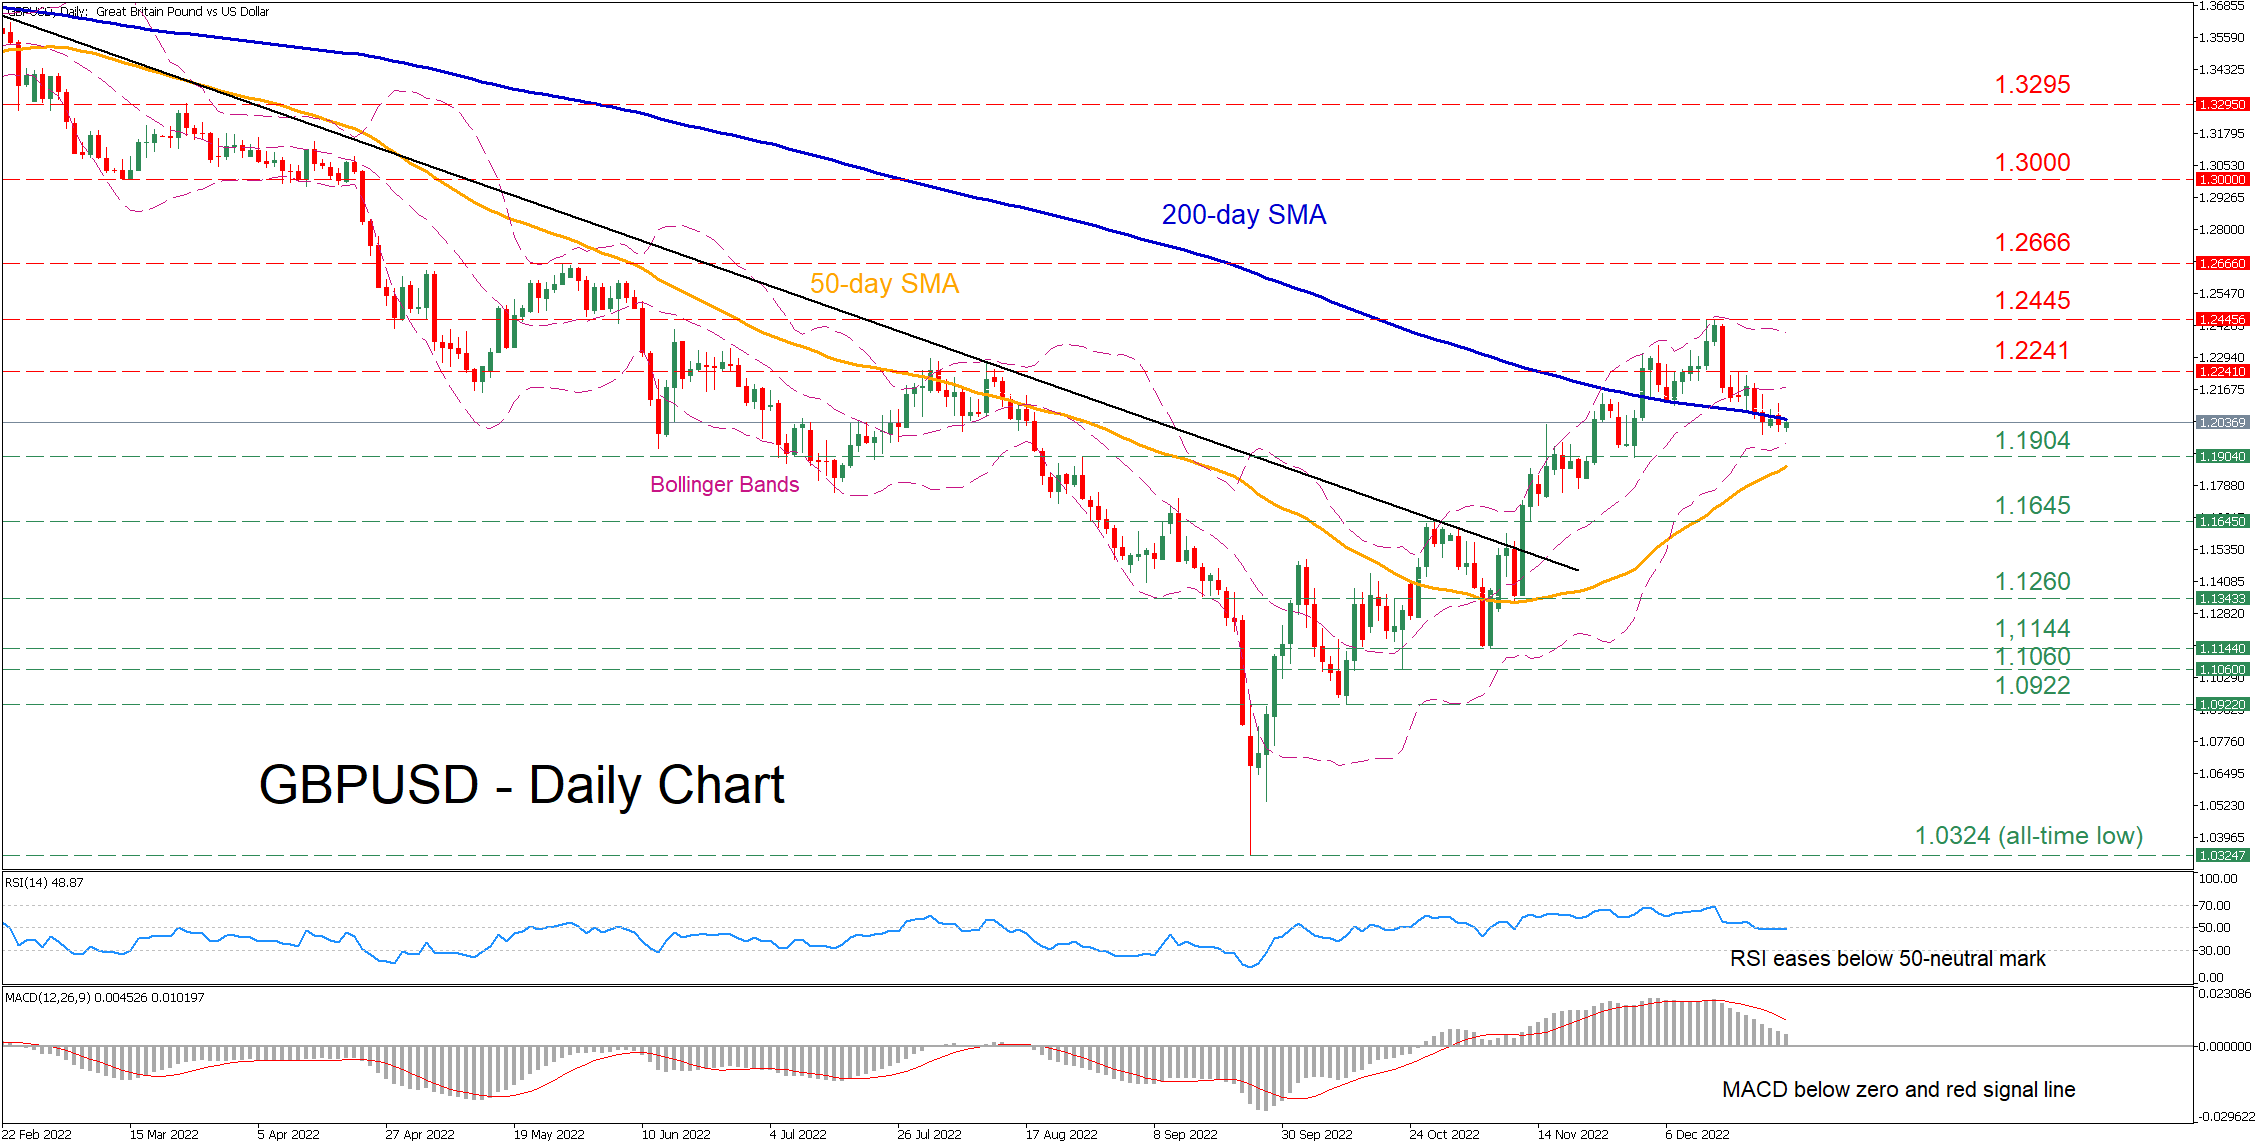
GBPUSD has been edging higher after finding its feet at the all-time low of 1.0324 in late September. Even though the pair has staged a strong rebound, it is currently experiencing downside correction, with the 200-day simple moving average (SMA) acting as a strong floor.
The short-term oscillators currently suggest that bearish forces are in control. Specifically, the RSI slid below its 50-neutral mark, while the MACD histogram is declining below its red signal line in the positive territory.
If the negative momentum strengthens and the price extends its retreat, the recent low of 1.1904 might act as the first line of defence. Diving lower, the pair could challenge the October resistance of 1.1645 before the focus shifts to 1.1260. Failing to halt there, the November low of 1.1144 may curb further declines.
To the upside, bullish actions could propel the price towards the recent resistance region of 1.2241. Piercing through this zone, the bulls could aim at 1.2445, which rejected the pair’s medium-term rebound. Even higher, the May peak of 1.2666 could come under examination.
Overall, GBPUSD is experiencing a moderate pullback since its uptrend encountered significant resistance. Therefore, a dive beneath the 200-day SMA may accelerate the downfall.


