
A note on lower timeframe confirming price action…
Waiting for lower timeframe confirmation is our main tool to confirm strength within higher timeframe zones, and has really been the key to our trading success. It takes a little time to understand the subtle nuances, however, as each trade is never the same, but once you master the rhythm so to speak, you will be saved from countless unnecessary losing trades. The following is a list of what we look for:
- A break/retest of supply or demand dependent on which way you’re trading.
- A trendline break/retest.
- Buying/selling tails … essentially we look for a cluster of very obvious spikes off of lower timeframe support and resistance levels within the higher timeframe zone.
- Candlestick patterns. We tend to only stick with pin bars and engulfing bars as these have proven to be the most effective.
We typically search for lower-timeframe confirmation between the M15 and H1 timeframes, since most of our higher-timeframe areas begin with the H4. Stops are usually placed 1-3 pips beyond confirming structures.
EUR/USD
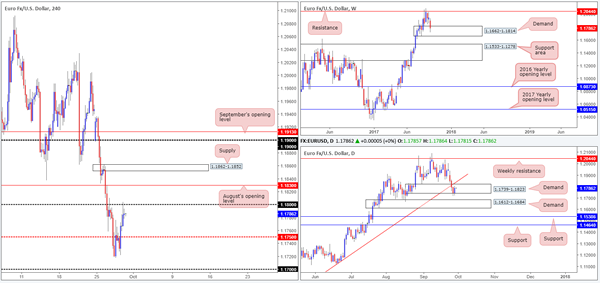
Across the board, we can see that the US dollar sold off against the majority of its trading peers on Thursday. USDX action shows price tapped the underside of H4 resistance at 11962 and also shook hands with daily supply coming in at 11969-11938. Consequent to this, the EUR was able to muster enough strength to breach the H4 mid-level resistance at 1.1750 and touch gloves with the 1.18 handle going into the closing bell.
Technically speaking, the single currency has been entrenched within a strong uptrend since the beginning of the year. Couple this with the current weekly demand pegged at 1.1662-1.1814, higher prices may be on the cards today/next week. On the daily timeframe, demand at 1.1739-1.1823, although recently suffered a minor breach, managed to remain in the game yesterday. The only grumble from this angle is the nearby trendline resistance extended from the low 1.0839 which could potentially halt further buying.
Suggestions: To our way of seeing things, neither a long nor short is attractive this morning as the market appears restricted from both ends right now.
To the upside, buyers have to contend with not only the 1.18 handle and August’s opening level at 1.1830, there’s also the daily trendline resistance to consider as well. Selling from 1.18 is just as tricky since a short would effectively place one against potential weekly and daily buyers (see above).
Data points to consider: German Retail sales m/m at 7am; EUR CPI flash estimate y/y at 10am. US Core PCE at 1.30pm; FOMC member Harker speaks at 4pm GMT+1.
Levels to watch/live orders:
- Buys: Flat (stop loss: N/A).
- Sells: Flat (stop loss: N/A).
GBP/USD
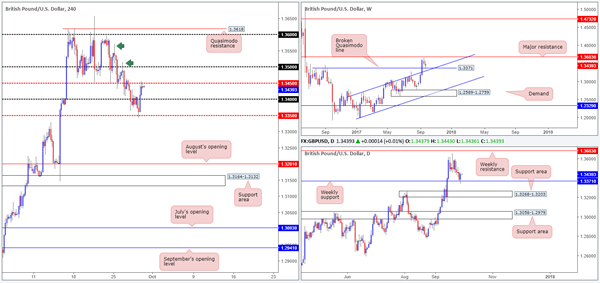
Looking at the weekly timeframe this morning, it’s clear to see the major establishing support from a broken Quasimodo line at 1.3371. Providing that the bulls remain in the driving seat here, the next resistance on tap can be seen at 1.3683.
Weekly buying, as you can see on the H4 timeframe, forced the British pound above the 1.34 handle on Thursday and eventually up to the mid-level resistance at 1.3450 by the day’s end. The pair is likely to find temporary resistance around this mid-way point with it having been a reasonably conspicuous point of support last week.
Suggestions: Given the GBP’s underlying trend at the moment, along with current weekly support, the team is biased to the upside. However, it will only be once price has crossed above 1.3450 will the desk look to become buyers in this market. A retest of 1.3450 as support, coupled with a reasonably sized H4 bull candle, preferably in the shape of a full or near-full-bodied candle, would be ideal buying conditions.
Should this trade come to fruition, the ultimate target is the 1.36 neighborhood. We’ve chosen this level due to the H4 consumption wicks seen marked with green arrows at 1.3514/1.3570. These two candles, in our technical view, likely cleared a high percentage of unfilled orders in the market, thus once price returns to the areas the unit should not have too much of a hard time pressing higher.
Data points to consider: UK Current account and final GDP q/q figures at 9.30am; BoE Gov. Carney speaks at 3pm. US Core PCE at 1.30pm; FOMC member Harker speaks at 4pm GMT+1.
Levels to watch/live orders:
- Buys: Watch for H4 price to close above 1.3450 and then look to trade any retest seen thereafter ([waiting for a H4 bullish rotation candle to form following the retest is advised] stop loss: ideally beyond the candle’s tail).
- Sells: Flat (stop loss: N/A).
AUD/USD
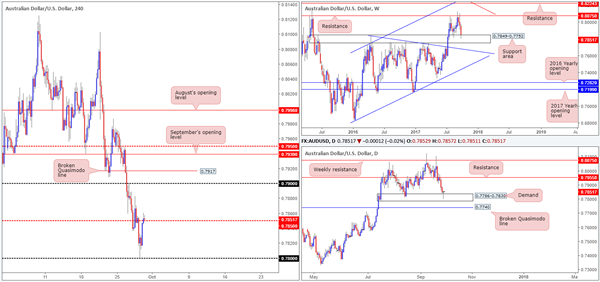
Trade update: taken out at breakeven – 0.7839.
As the USDX H4 timeframe crossed swords with resistance at 11962 yesterday, the commodity currency simultaneously shook hands with the 0.78 psychological band. Strengthening the bulls from here, nevertheless, is both weekly and daily structure. On the weekly timeframe, the unit is currently seen retesting a support area at 0.7849-0.7752 that stretches as far back as mid-2015. Down on the daily timeframe, price is also trading from a strong-looking demand at 0.7786-0.7838 (housed within the walls of the noted weekly support area), which, as you can see, forced candle action to chalk up a reasonably attractive buying tail yesterday.
So, the question is, where do we go from here? From a technical standpoint, we’re expecting the Aussie to extend gains today/next week up to at least the 0.79 handle/H4 broken Quasimodo line at 0.7917. Seeing as the H4 candles recently cleared the 0.7850 mid-way resistance line, a long on the retest of this base could be an option.
Suggestions: Drill down to the lower timeframes and try to pin down a long entry off 0.7850. For ideas on how to use lower-timeframe action as a means of entry, check out the top of this report.
Data points to consider: Chinese Caixin manufacturing PMI at 2.45am. US Core PCE at 1.30pm; FOMC member Harker speaks at 4pm GMT+1.
Levels to watch/live orders:
- Buys: 0.7850 region ([waiting for lower-timeframe confirmation here is advised] stop loss: dependent on where one confirms this area).
- Sells: Flat (stop loss: N/A).
USD/JPY
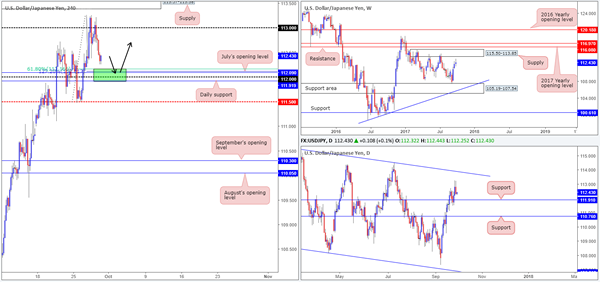
The USD/JPY experienced a somewhat aggressive downside move on Thursday after whipsawing through the underside of the 113 handle. Influenced by overall dollar losses (USDX traded from H4 resistance at 11962), the pair ended the day closing 30 or so pips ahead of the 112 handle.
Although intraday movement shows bids coming into the market as we write, the 112 handle is, in our technical view, an incredibly appealing level at the moment. Here’s why:
Positioned directly above daily support at 111.91.
Located just below July’s opening level at 112.09.
Nearby a 61.8% Fib support at 112.16 taken from the low 111.47.
Boasts a 127.2% Fib ext. point at 112.12 extended from the high 113.25.
Suggestions: With space seen for both weekly and daily action to push higher, coupled with the 112 handle’s surrounding confluence mentioned above, longs from the green H4 buy zone are worthy of attention. As psychological levels are prone to fakeouts, however, the team has decided to wait for H4 price to confirm buyer intent before pulling the trigger. For us, this would simply be a full or near-full-bodied bullish candle formed within the green zone, which would give us the confidence to hold up to at least 113/H4 supply at 113.57-113.38.
Data points to consider: US Core PCE at 1.30pm; FOMC member Harker speaks at 4pm GMT+1.
Levels to watch/live orders:
- Buys: 111.91/112.16 ([waiting for a reasonably sized H4 bullish candle to form – preferably a full, or near-full-bodied candle – is advised] stop loss: ideally beyond the candle’s tail).
- Sells: Flat (stop loss: N/A).
USD/CAD
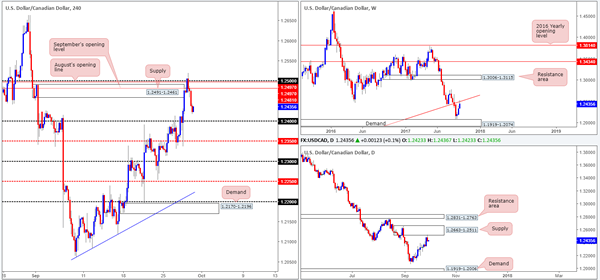
For those who read Thursday’s tech report you may recall our team highlighting the possibility of H4 price faking above supply at 1.2491-1.2461. As you can see, the unit did not only fake above this supply, it also pierced above August’s opening level at 1.2497/1.25 handle. This was to be expected. Not only because psychological levels are prone to fakeouts, but also due to what was lurking above these H4 structures – a daily supply at 1.2663-1.2511 that fused with a long-term weekly trendline resistance etched from the low 0.9633.
We also went on mention that if you were looking to take advantage of any potential move lower from this region, it’d be best to wait for additional candle confirmation in the form of a full or near-full-bodied bearish candle. As can be clearly seen on the H4 chart, following the fakeout a nice-looking near-full-bodied candle came to fruition and thereby allowed us to short at 1.2479 with a stop pegged just above the candle’s wick at 1.2521. Well done to any of our readers who managed to jump aboard this move!
Suggestions: We recently reduced risk to breakeven on our current short. The first take-profit target for us is 1.24. Here we’ll look to take 50% off the table and then begin eyeing the 1.2350 base as a second line of interest.
Apart from our current short call, we do not see much else to hang our hat on at the moment.
Data points to consider: US Core PCE at 1.30pm; FOMC member Harker speaks at 4pm. Canadian growth figures at 1.30pm GMT+1.
Levels to watch/live orders:
- Buys: Flat (stop loss: N/A).
- Sells: 1.2479 ([live] stop loss: breakeven).
USD/CHF:
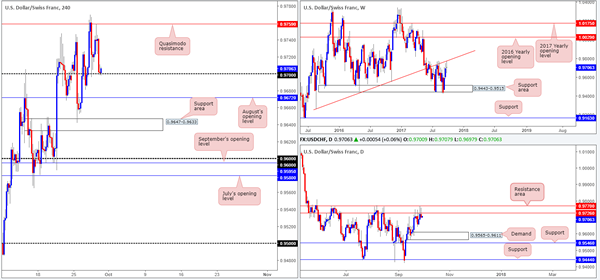
The USD/CHF corrected sharply lower after H4 price revisited the Quasimodo resistance at 0.9759 during trade yesterday, consequently forcing the Swissy back down to the 0.97 neighborhood. Despite this psychological number holding firm on Wednesday, there’s a good chance that we’re going to see this level give way soon. Our rationale behind this approach stems from higher-timeframe structure. Weekly price is seen trading from a trendline resistance extended from the low 0.9257. Alongside this, we can also see that daily price trading from a resistance area pegged at 0.9770/0.9726 in the shape of a nice-looking selling wick.
Suggestions: A break below 0.97, although both the weekly and daily timeframes indicate further selling could be on the cards, is unfortunately a challenging sell. This is because of August’s opening level plotted just below at 0.9672, followed closely by a H4 support area at 0.9647-0.9633. Therefore, opting to stand on the sidelines today may be the better bet today.
Data points to consider: US Core PCE at 1.30pm; FOMC member Harker speaks at 4pm GMT+1.
Levels to watch/live orders:
- Buys: Flat (stop loss: N/A).
- Sells: Flat (stop loss: N/A).
DOW 30:
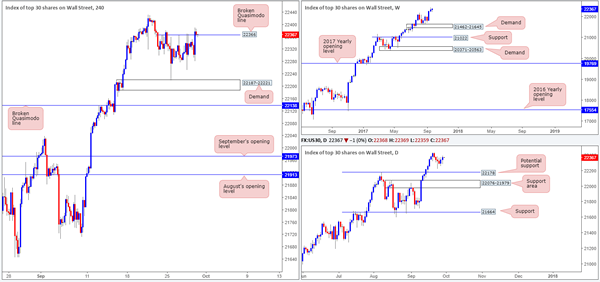
US equities extended higher for a second consecutive day yesterday, forcing H4 price to marginally close beyond the Quasimodo resistance line at 22366. With this line now acting as possible support, there’s a chance that the index could gravitate higher from here today. Why? Well, the key thing to remember here is this market remains entrenched within a strong uptrend, and is trading from record highs. This – coupled with offers likely cleared from the noted H4 barrier, along with little to no resistance seen on the higher timeframes, further upside is the favored approach, in our humble opinion.
Suggestions: To trade long from the current H4 level though, the desk has agreed that waiting for a reasonably strong H4 bull candle to take shape in the form of a full or near-full-bodied candle would be the better path to take. Should a trade come to fruition from this angle, a break to fresh record highs would be our cue to reduce risk to breakeven and look for fresh support to form.
Data points to consider: US Core PCE at 1.30pm; FOMC member Harker speaks at 4pm GMT+1
Levels to watch/live orders:
- Buys: 22366 ([waiting for a H4 bullish rotation candle to form is advised] stop loss: ideally beyond the candle’s tail).
- Sells: Flat (stop loss: N/A).
GOLD
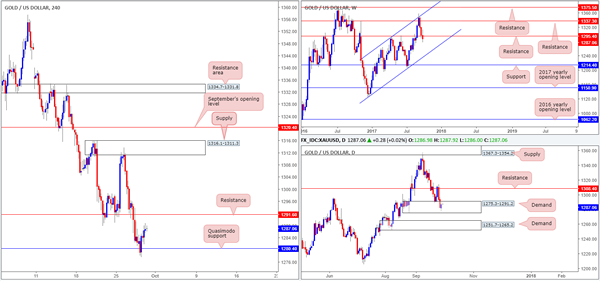
Breaking a two-day bearish phase, the bulls recovered nicely from a H4 Quasimodo support at 1280.4 yesterday, placing H4 price within striking distance of resistance coming in at 1291.6. Bolstering yesterday’s upside move, however, was daily price which is seen trading from within the walls of a demand base penciled in at 1275.3-1291.2. Further upside from this vicinity could lead to the yellow metal shaking hands with resistance at 1308.4. On the other side of the coin, we can see that weekly price remains beneath resistance at 1295.4. A continued move to the downside from here would likely bring gold into contact with a channel support extended from the low 1122.8.
Suggestions: In view of the unit’s close proximity to H4 resistance, as well as weekly action trading below a major resistance barrier, buying this market on the basis of price occupying the current daily demand is not something we’d stamp as a high-probability move. Having said that, selling would be just as risky, in our opinion, as although you’d effectively be trading in-line with weekly/H4 flow, you’d simultaneously be selling into potential daily buying!
Considering the above, the team has concluded that remaining flat is the safer route to take today.
Levels to watch/live orders:
- Buys: Flat (stop loss: N/A).
- Sells: Flat (stop loss: N/A).