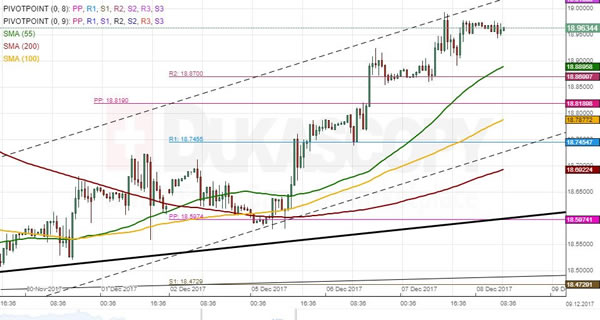
USD/MXN has been trading in a neat channel up for the last five months. The pair bounced off the bottom boundary of this medium-term pattern on November 29 and has since initiated a new wave up. It is likely that the pair respects the current channel and thus continues appreciating during the following two weeks up to the 19.40 area. In the meantime, the US Dollar has been testing a junior channel for a couple of hours. Its failure to surpass the 18.67 area suggests that the rate could egde lower in this session. The nearest resistance is set by the weekly R2 and the 55-hour SMA circa 18.87, while a more probable downside target is the 18.80 area where the 100-hour SMA and the weekly R1 are located.