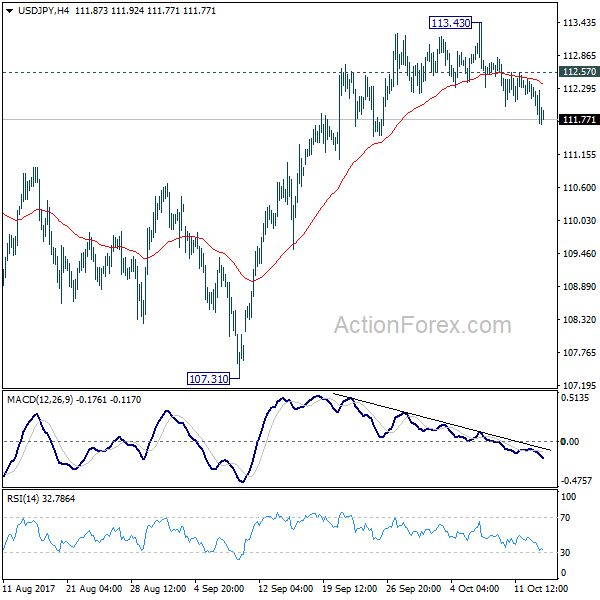
USD/JPY’s decline last week indicates short term topping at 113.43. That was on bearish divergence condition in 4 hour MACD, after failing to sustain above medium term falling trend line. The development argues that rebound from 107.31 could have completed already. And fall from 113.43 might be another leg of medium term correction from 118.65. Initial bias stays on the downside this week for 55 day EMA (now at 111.37) first. Sustained break will target 107.31 low and below. In that case, we’d expect strong support from 61.8% retracement of 98.97 to 118.65 at 106.48 to contain downside and bring rebound. On the upside, above 112.57 minor resistance will turn intraday bias neutral first. But risk will stays on the downside as long as 113.43 resistance holds.
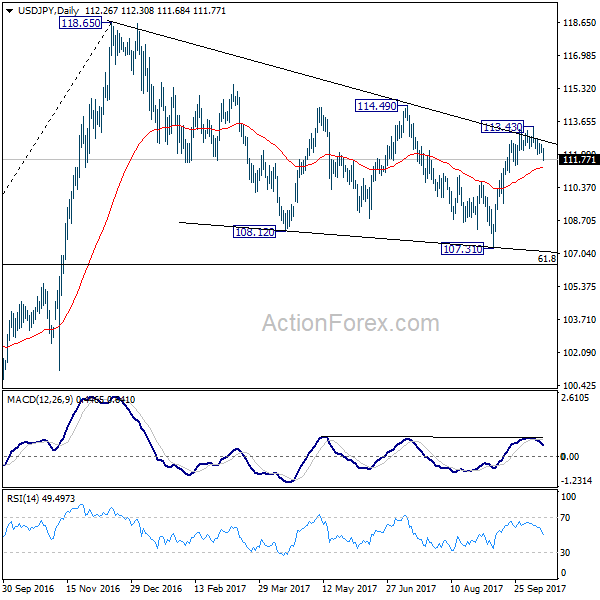
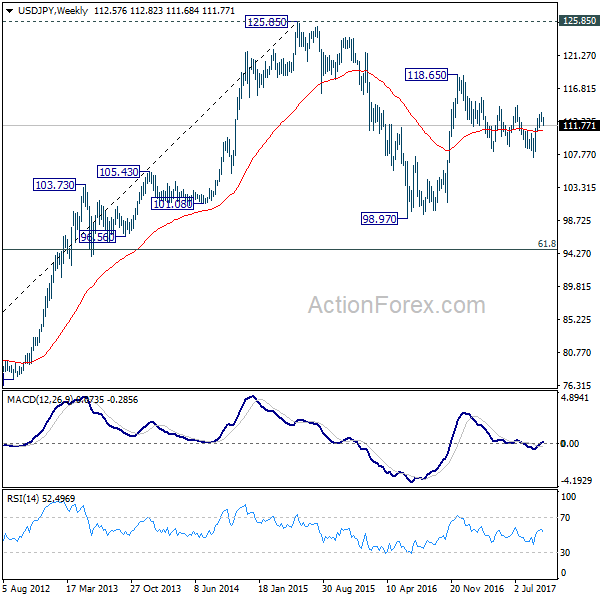
In the bigger picture, rise from 98.97 (2016 low) is seen as the second leg of the corrective pattern from 125.85 (2015 high). It’s unclear whether this second leg has completed at 118.65 or not. But medium term outlook will be mildly bearish as long as 114.49 resistance holds. And, there is prospect of breaking 98.97 ahead. Meanwhile, break of 114.49 will bring retest of 125.85 high. But even in that case, we don’t expect a break there on first attempt.
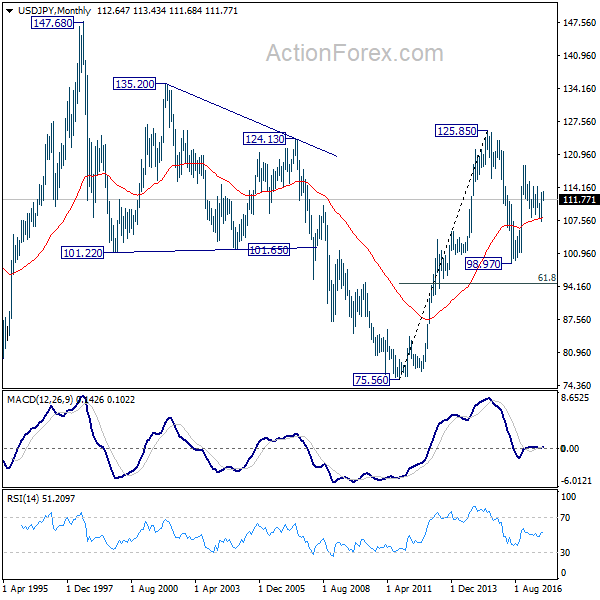
In the long term picture, the rise from 75.56 (2011 low) long term bottom to 125.85 top is viewed as an impulsive move, no change in this view. Price actions from 125.85 are seen as a corrective move which could still extend. In case of deeper fall, downside should be contained by 61.8% retracement of 75.56 to 125.85 at 94.77. Up trend from 75.56 is expected to resume at a later stage for above 135.20/147.68 resistance zone.