EUR/USD
The EUR/USD showed a strong bullish pinbar candlestick pattern at support, which could confirm the completion of wave X (pink) and the start of a larger wave Y (pink).
Daily chart:
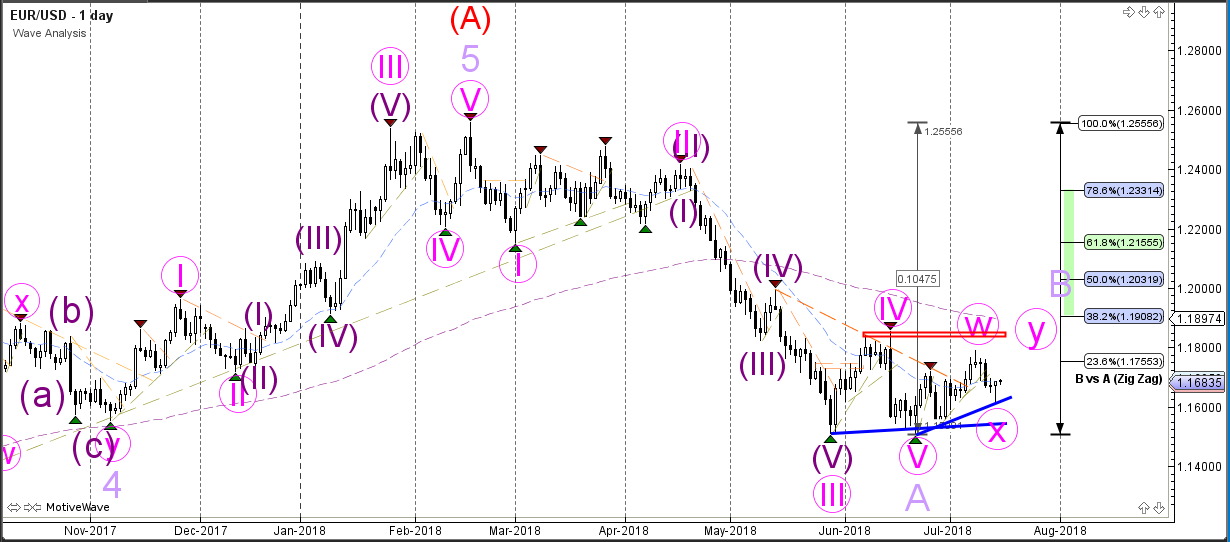
The EUR/USD seems to be building a bearish ABC (purple) correction within wave B (red).
Weekly chart:
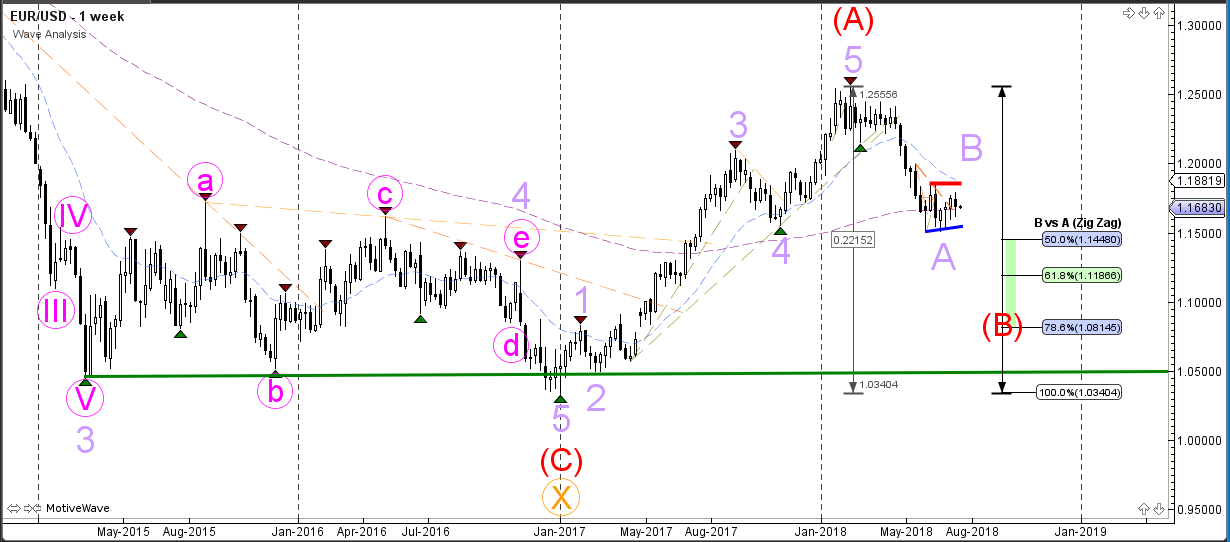
The EUR/USD has probably completed wave A (red) and price is now most likely retracing to the Fibonacci levels of wave B (red).
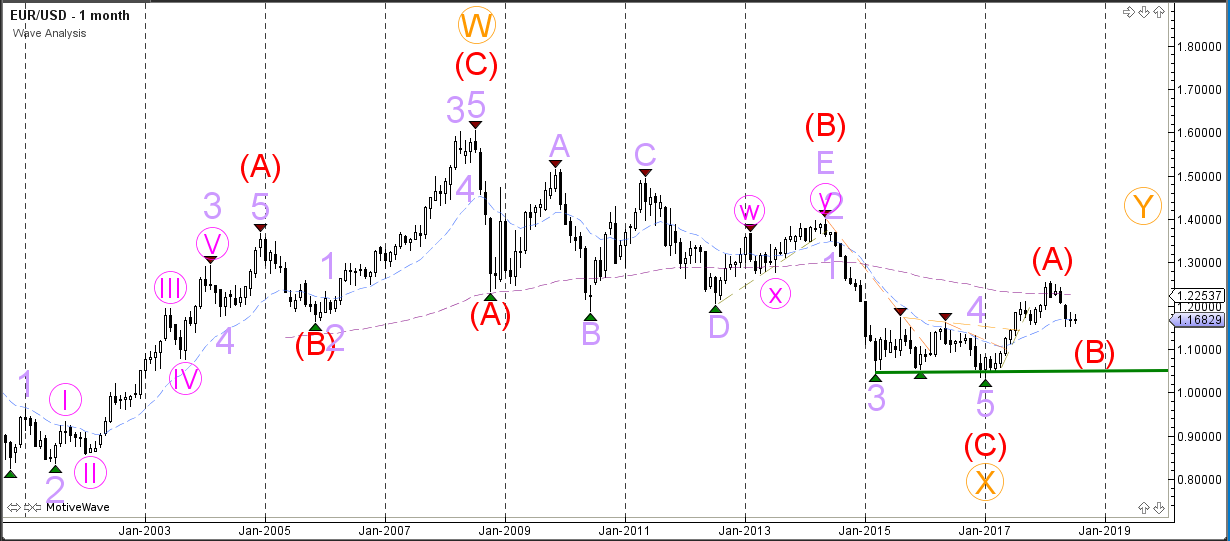
Monthly chart:
GBP/USD
The GBP/USD is showing a bullish pinbar on the daily chart as well, just as the EUR/USD. This could indicate the end of a wave X (purple) and the start of a larger bullish correction within wave 2 (pink).
Daily chart:
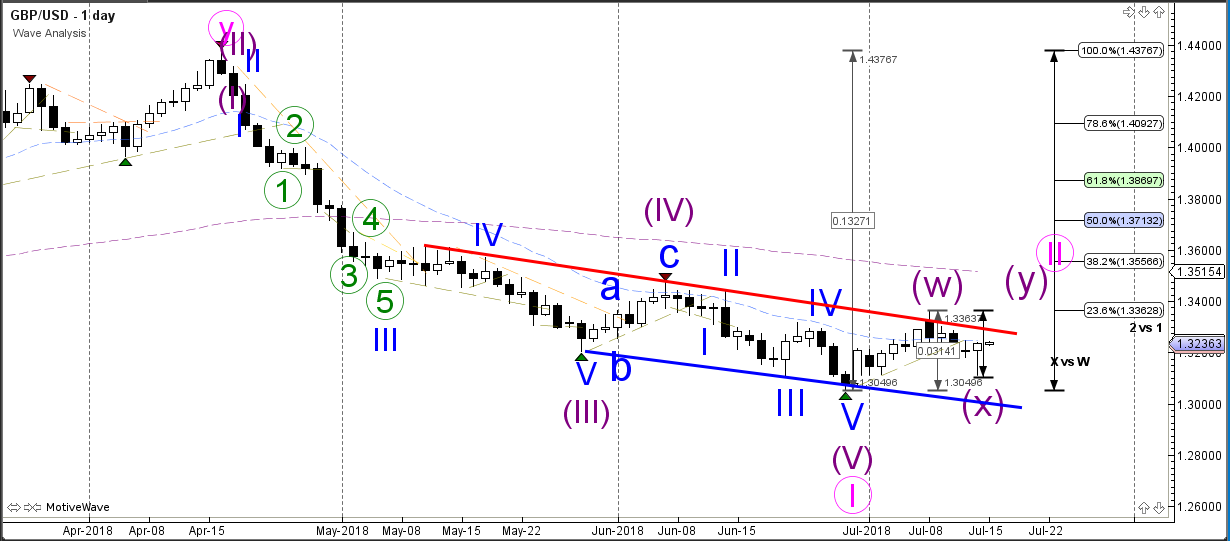
The GBP/USD has probably started the bearish wave 5 after price has completed a wave 4 (light purple) correction.
Weekly chart:
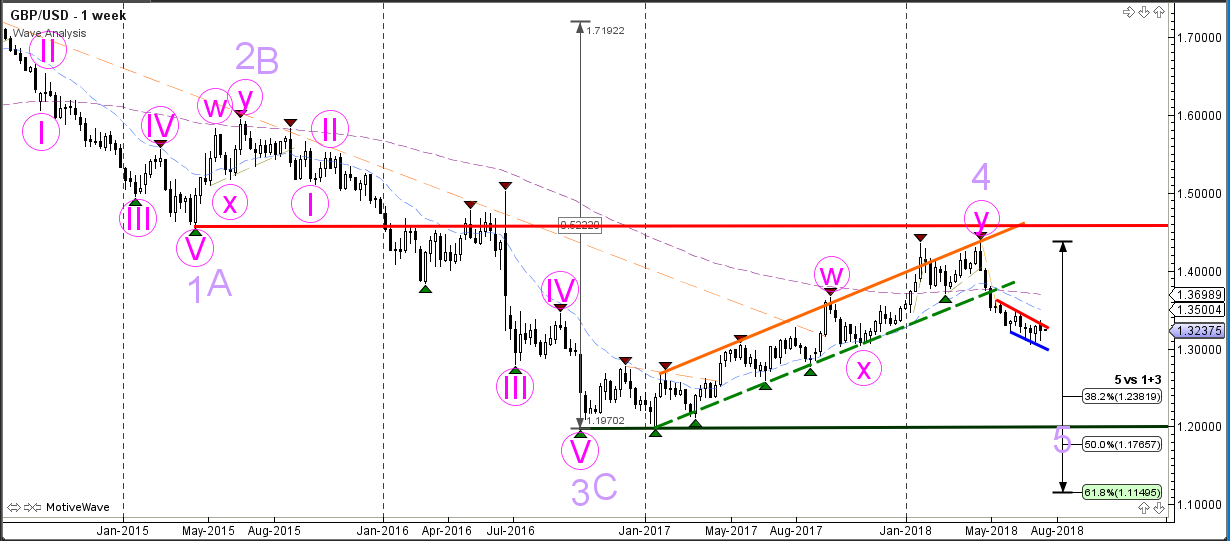
The GBP/USD bearish breakout could see the continuation of the wave 5 (purple) whereas a bullish break above resistance (red) could indicate that a wave C has been completed at the bottom.
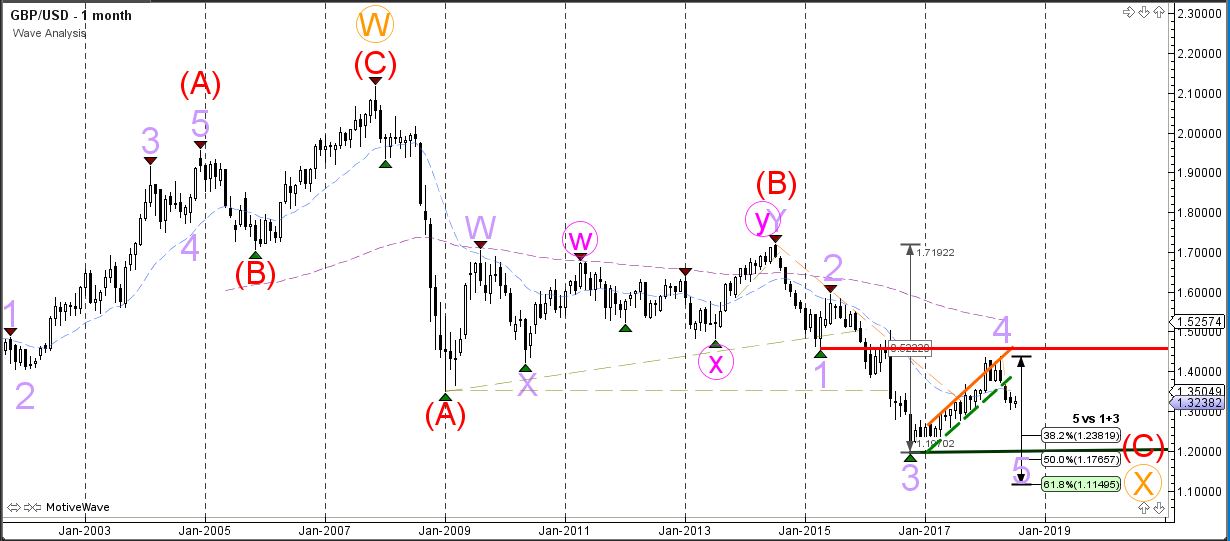
Monthly chart:
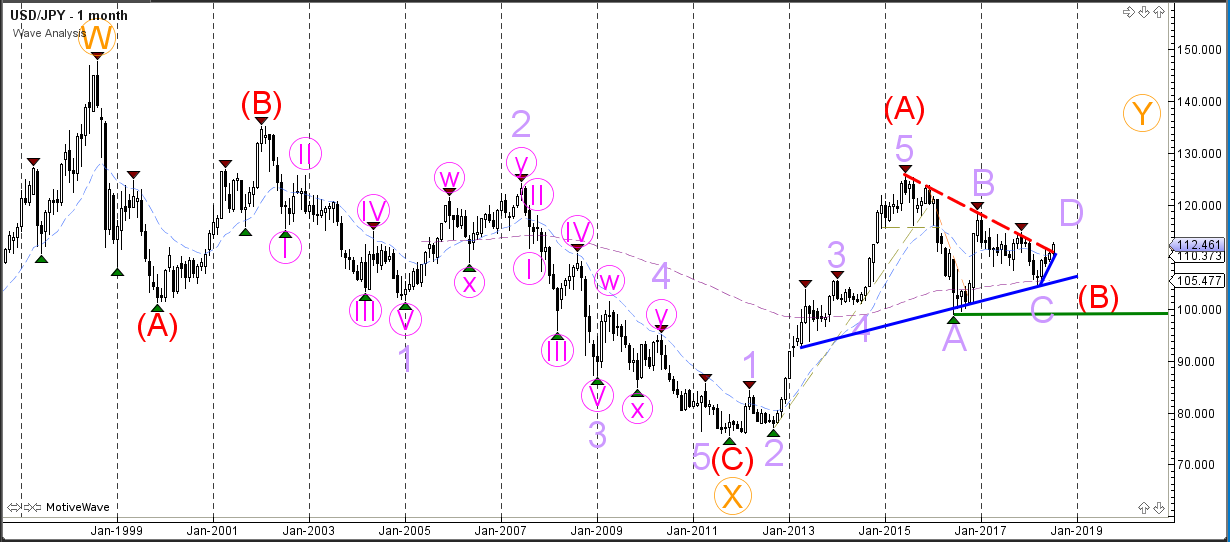
USD/JPY
The USD/JPY broke above the resistance trend line (dotted red) and the bullish breakout is now moving towards the Fibonacci targets.
Daily chart:
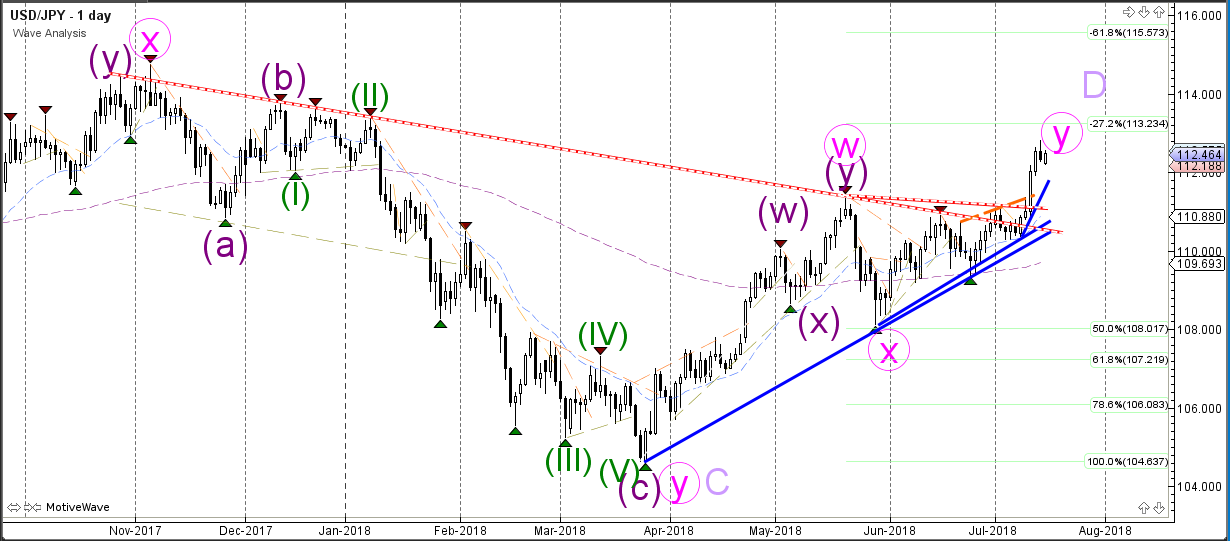
The USD/JPY could be building an ABCDE triangle (light purple) within wave B (red).
Weekly chart:
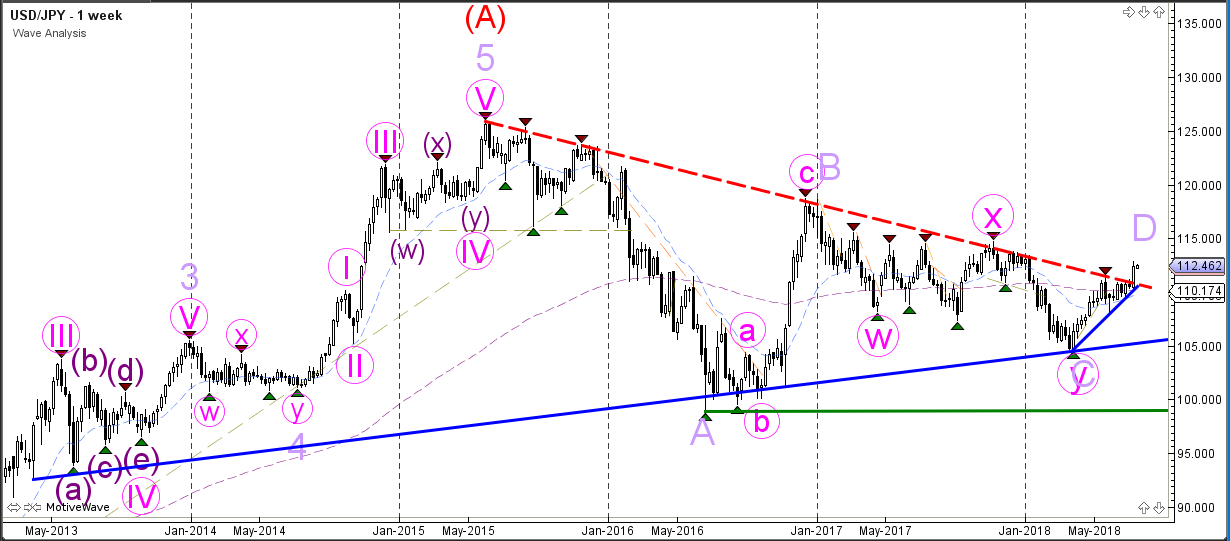
The USD/JPY is in the wave D (light purple) of the triangle pattern.
Monthly chart: