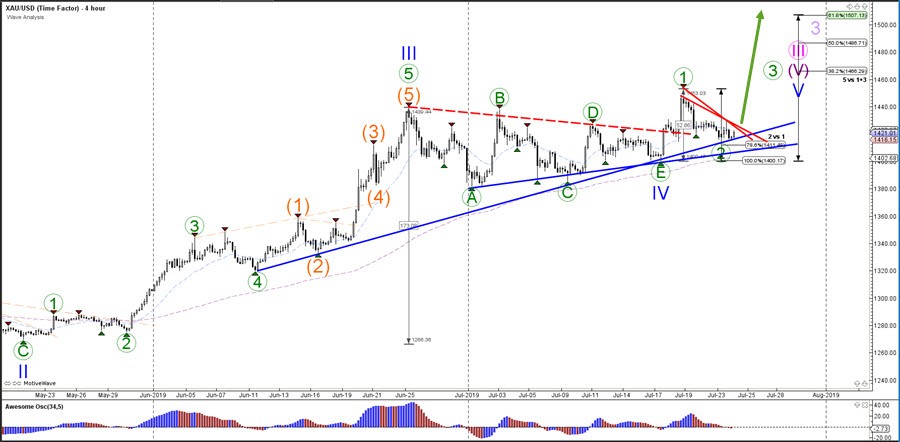
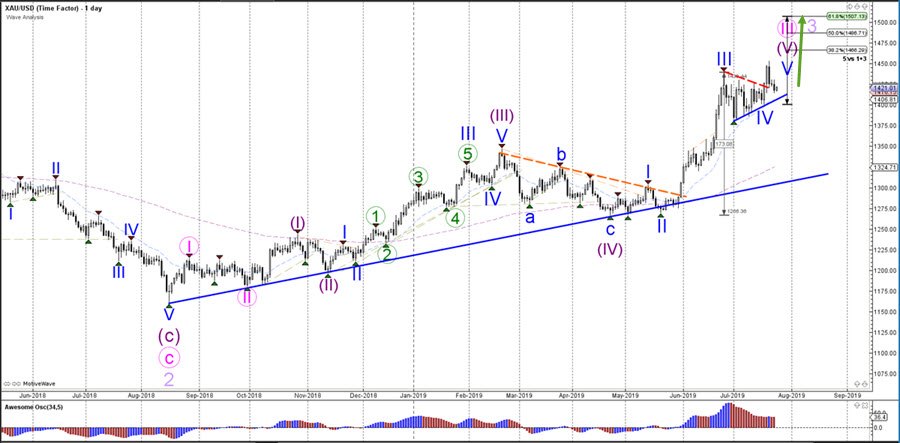
The current wave outlook is suggesting that the uptrend is not finished yet and a continuation of the bullish trend is likely to take place within a wave 3 (pink). The triangle chart pattern was most likely wave 4 (blue) consolidation and price has started a wave 5 (blue) breakout.
The XAU/USD could have made a bullish wave 1 (green) and the current pullback could be a deep wave 2 (green) retracement. This wave outlook remains valid as long as price stays above the 100% Fibonacci levels of wave 2 vs 1. A break above the resistance trend lines (red) could indicate the start of the wave 3 (green) and a move higher towards the Fibbonacci targets of wave 5 vs 1+3.