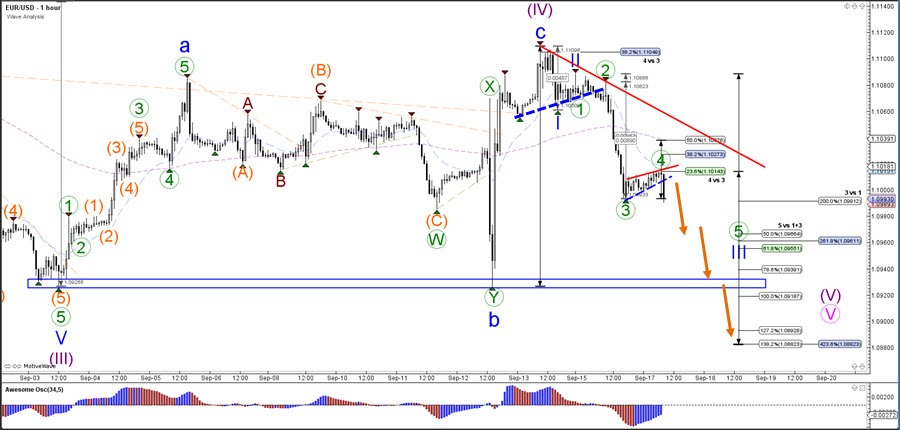
The EUR/USD seems to have completed its expected bullish ABC (blue) zigzag pattern, now that the price action has turned heavily bearish. This makes sense because the 38.2% Fibonacci level of wave 4 vs 3 is also a very common Fib level for a wave 4. A bearish breakout below the support trend line (blue) and previous bottom (blue box) could confirm the bearish continuation towards the Fibonacci targets of wave 5 vs 1+3.
The EUR/USD break below the support trend line (dotted blue) turned out to be a wave 3 (green) rather than a wave C due to the strong impulsive character of the price action. The mild and corrective bullish price action after the decline is also another confirmation clue that the price is in a wave 4 (green) pattern and likely to test the previous bottom. This remains valid if the price stays below the 50% Fibonacci level of wave 4 vs 3.