
The EUR/USD currency pair
Technical indicators of the currency pair:
Prev Open: 1.11303
Open: 1.11036
% chg. over the last day: -0.25
Day’s range: 1.11008 – 1.11094
52 wk range: 1.0884 – 1.1623
The EUR/USD currency pair went down after a long growth. The trading tool has updated local lows. The ECB, as expected, kept the basic parameters of monetary policy at the same level. A number of weak business activity indicators in Germany and the EU pushed the EUR down. At the moment, EUR/USD quotes are consolidating in the range of 1.10850-1.11150. The single currency has the potential for further correction. Open positions from the key levels.
At 11:00 (GMT + 3: 00), the German IFO business climate index will be published.
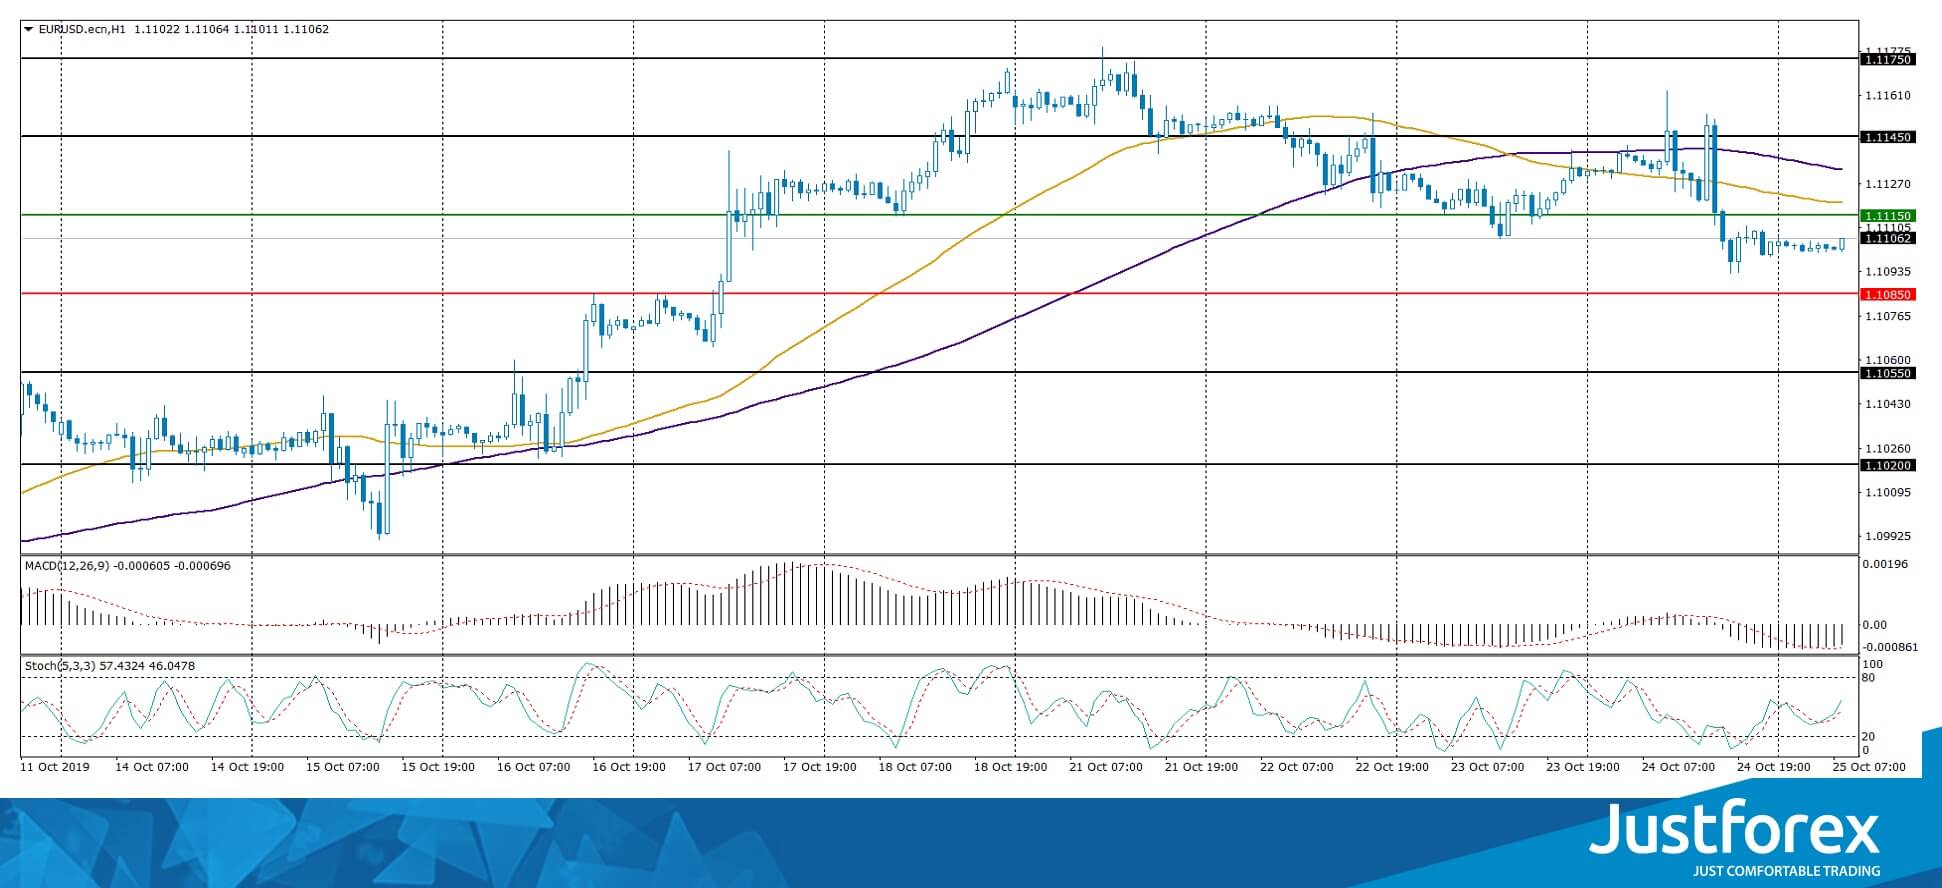
Indicators signal the strength of sellers: the price has fixed below 50 MA and 100 MA.
The MACD histogram is in the negative zone, but above the signal line, which gives a weak signal to sell EUR/USD.
The Stochastic Oscillator is in the neutral zone, the %K line is above the %D line, which indicates bullish sentiment.
Trading recommendations
Support levels: 1.10850, 1.10550, 1.10200
Resistance levels: 1.11150, 1.11450, 1.11750
If the price consolidates below the level of 1.10850, expect a further fall to 1.10600-1.10300.
Alternatively the quotes could grow to 1.11400-1.11600.
The GBP/USD currency pair
Technical indicators of the currency pair:
Prev Open: 1.29140
Open: 1.28513
% chg. over the last day: -0.62
Day’s range: 1.28342 – 1.28581
52 wk range: 1.1959 – 1.3385
Yesterday, sales prevailed on the GBP/USD currency pair. The fall in quotes exceeded 70 points. The pound is still under pressure due to the uncertainty surrounding Brexit. We recommend that you keep track of current information on this issue. The trading instrument is currently consolidating. The local support and resistance levels are: 1.28000 and 1.28800, respectively. Sterling has the potential to further decline. Open positions from the key levels.
The Economic News Feed is calm.
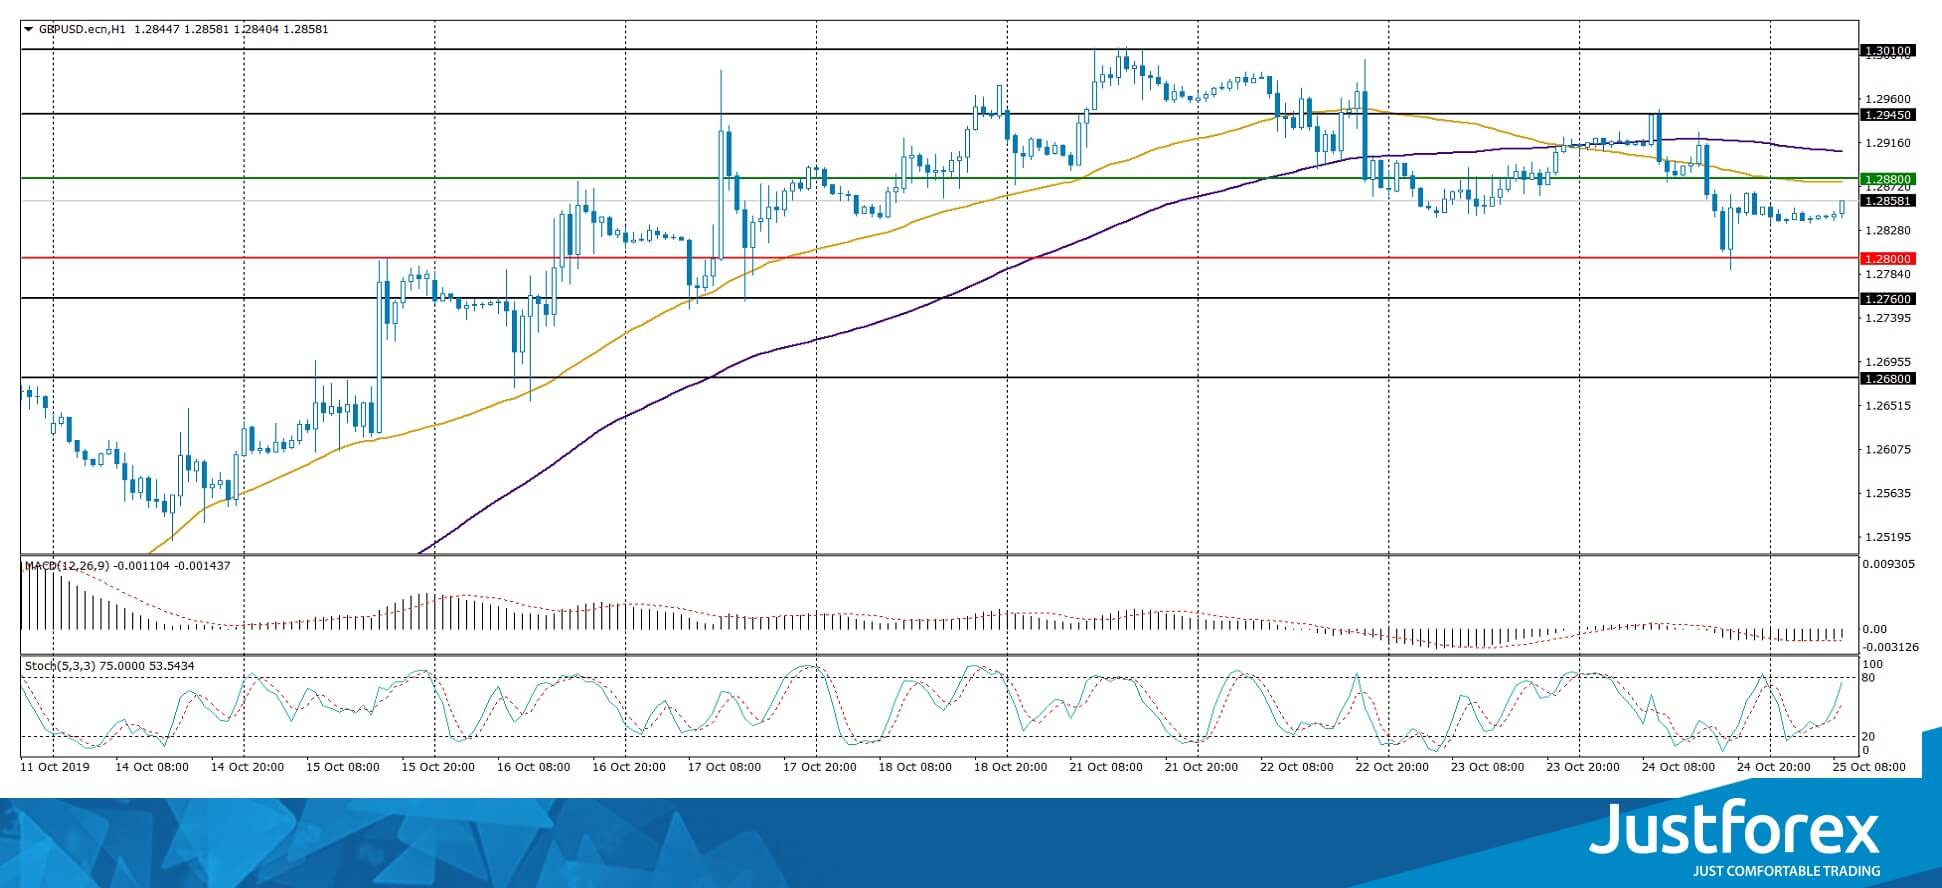
Indicators do not give accurate signals: 50 MA crossed 100 MA.
The MACD histogram is in the negative zone but above the signal line, which gives a weak signal to sell GBP/USD.
The Stochastic Oscillator is in the neutral zone, the %K line is above the %D line, which indicates bullish sentiment.
Trading recommendations
Support levels: 1.28000, 1.27600, 1.26800
Resistance levels: 1.28800, 1.29450, 1.30100
If the price consolidates below 1.28000, expect a drop toward 1.27500-1.27000.
Alternatively, the quotes could grow toward 1.29400-1.29800.
The USD/CAD currency pair
Technical indicators of the currency pair:
Prev Open: 1.30717
Open: 1.30696
% chg. over the last day: -0.07
Day’s range: 1.30651 – 1.30767
52 wk range: 1.2727 – 1.3664
The USD/CAD currency pair has stabilized. CAD is currently consolidating. There is no defined trend. The local support and resistance levels are 1.30550 and 1.30800, respectively. In the near future, the technical correction of USD/CAD quotes after a prolonged fall is not ruled out. We recommend that you pay attention to the dynamics of the prices for oil. Open positions from the key levels.
The Economic News Feed for 25.10.2019:
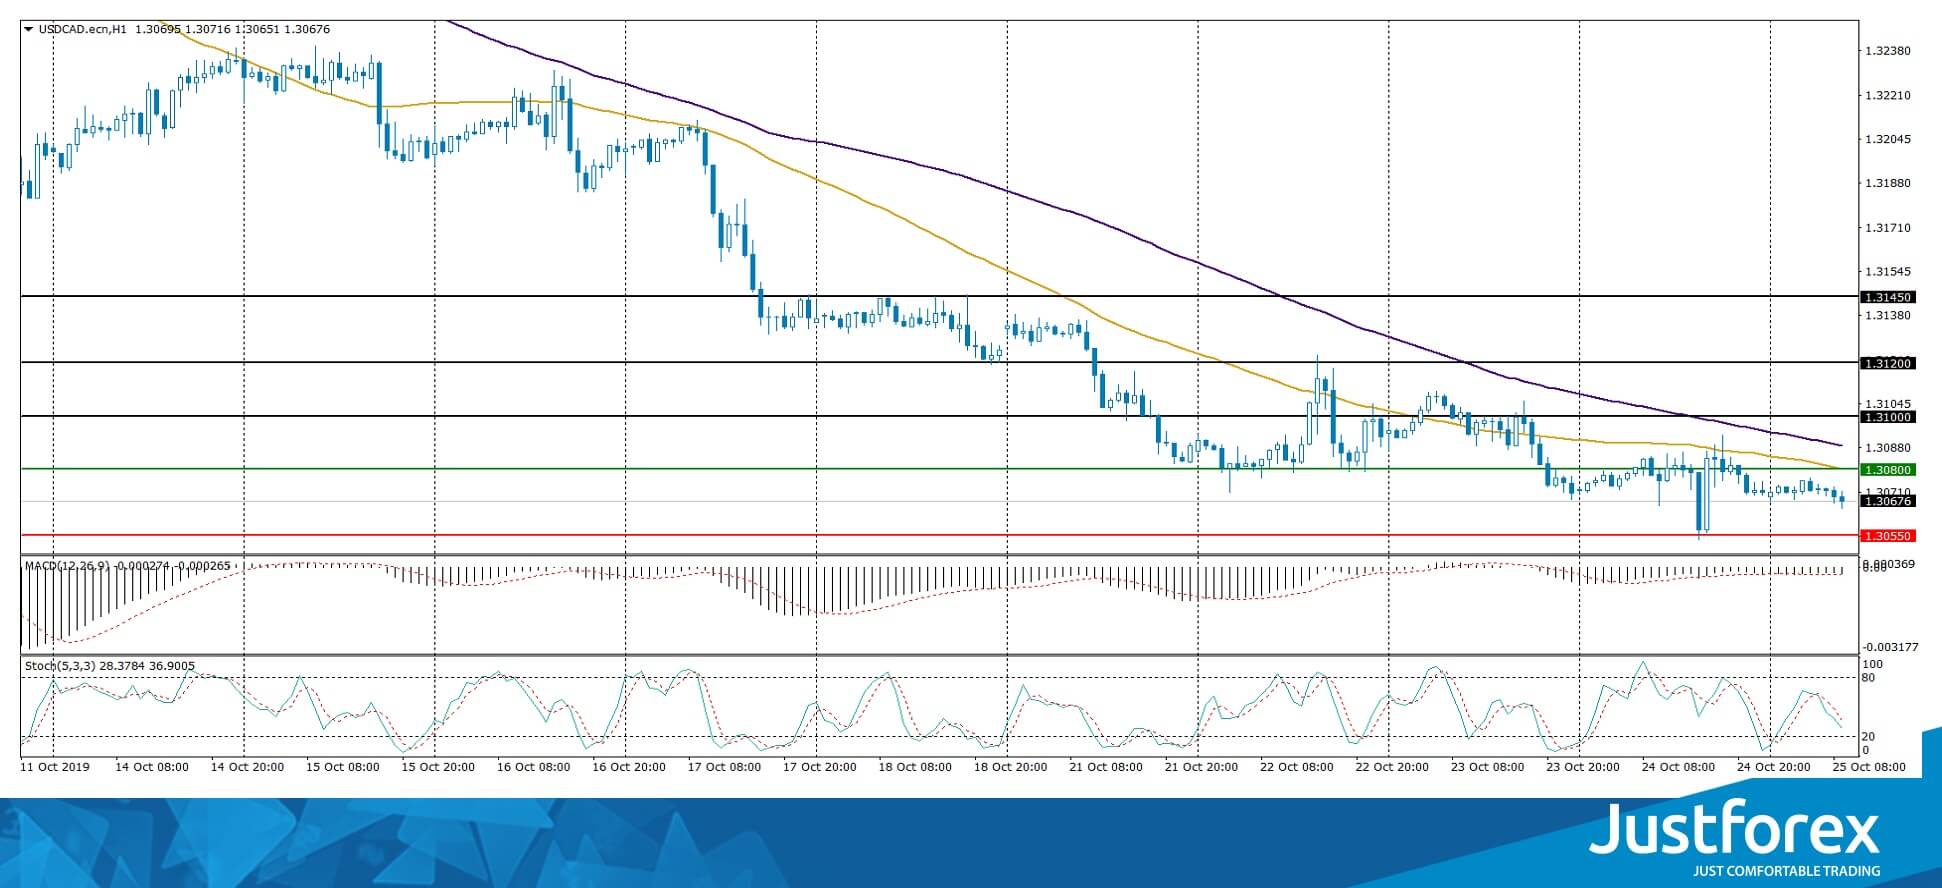
The price fixed below 50 MA and 100 MA, which signals the strength of sellers.
The MACD histogram is in the negative zone, indicating a bearish sentiment.
Stochastic Oscillator is in the neutral zone, the %K line is below the %D line, which also gives a signal to sell USD/CAD.
Trading recommendations
Support levels: 1.30550, 1.30200, 1.30000
Resistance levels: 1.30800, 1.31000, 1.31200
If the price consolidates below 1.30550, expect a drop toward 1.30200-1.30000.
Alternatively, the quotes could correct toward 1.31000-1.31200.
The USD/JPY currency pair
Technical indicators of the currency pair:
Prev Open: 108.671
Open: 108.598
% chg. over the last day: -0.07
Day’s range: 108.571 – 108.706
52 wk range: 104.97 – 114.56
The technical picture on the USD/JPY currency pair is still ambiguous. The trading instrument is in lateral movement. USD/JPY quotes test local support and resistance levels 108.500 and 108.700. Participants in financial markets expect additional drivers. We recommend that you pay attention to the dynamics of yield on US government bonds. Open positions from the key levels.
The Economic News Feed for 25.10.2019:
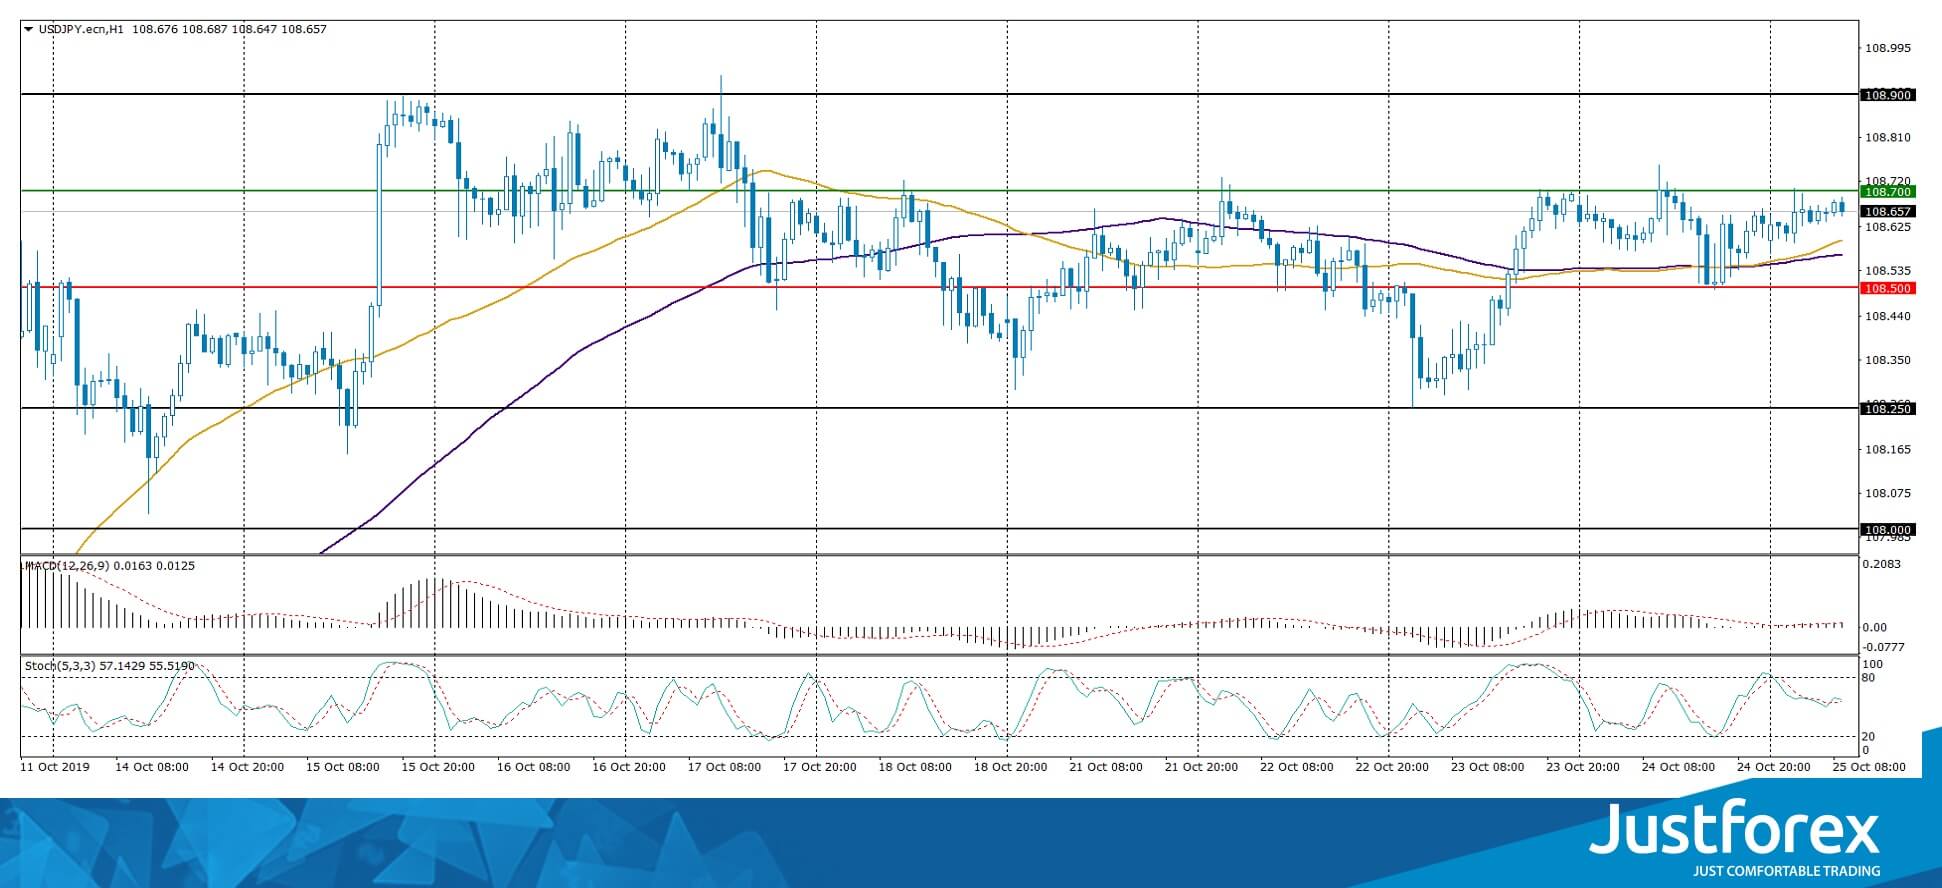
The price fixed above 50 MA and 100 MA, which signals the strength of buyers.
The MACD histogram has started to rise, indicating a bullish sentiment.
The Stochastic Oscillator is in the neutral zone, the %K line crossed the %D line. There are no signals at the moment.
Trading recommendations
Support levels: 108.500, 108.250, 108.000
Resistance levels: 108.700, 108.900
If the price consolidates below 108.500, USD/JPY is expected to fall to 108.300-108.100.
Alternatively, the quotes could grow toward 108.900-109.200.


