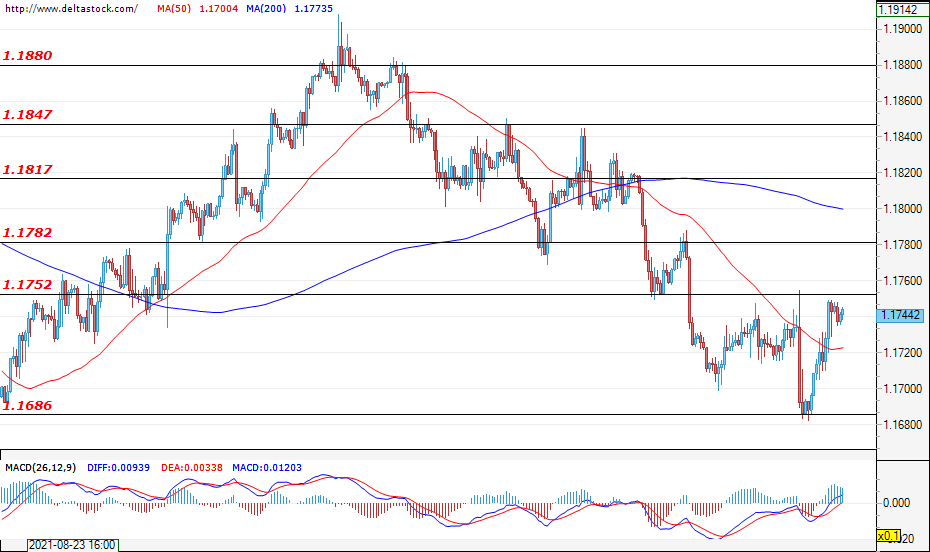
EUR/USD
Current level – 1.1744
During yesterday’s trading session, the currency pair tested the support zone at 1.1680 but the bulls managed to prevail and the U.S. dollar lost quite a bit of ground against the single European currency, with the pair moving towards the resistance at 1.1750. At the time of writing, the EUR/USD is consolidating just below the mentioned level and the sentiment is rather positive – for a test of the next more significant resistance at 1.1780. In the negative direction, the first support lies at the aforementioned level of 1.1680.
| Resistance | Support | ||
| intraday | intraweek | intraday | intraweek |
| 1.1752 | 1.1817 | 1.1686 | 1.1450 |
| 1.1782 | 1.1847 | 1.1600 | 1.1300 |
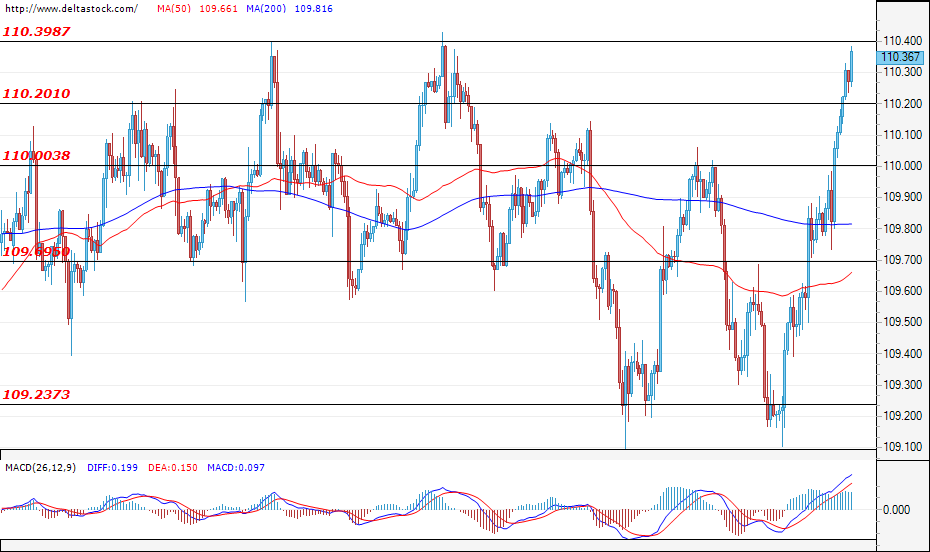
USD/JPY
Current level – 110.36
The bulls took control over the market and the pair successfully violated the resistance zone at 110.20. If the Ninja continues to gain positions and successfully breaches the resistance at 110.40, an upward movement towards the next level at 110.70 will be the most likely scenario. However, if the resistance at 110.40 withstands the pressure of the bulls and limits the impulsive upward movement, then the pair would most probably make a corrective move towards the support at 110.00.
| Resistance | Support | ||
| intraday | intraweek | intraday | intraweek |
| 110.40 | 110.70 | 110.20 | 109.70 |
| 110.70 | 111.00 | 110.00 | 109.23 |
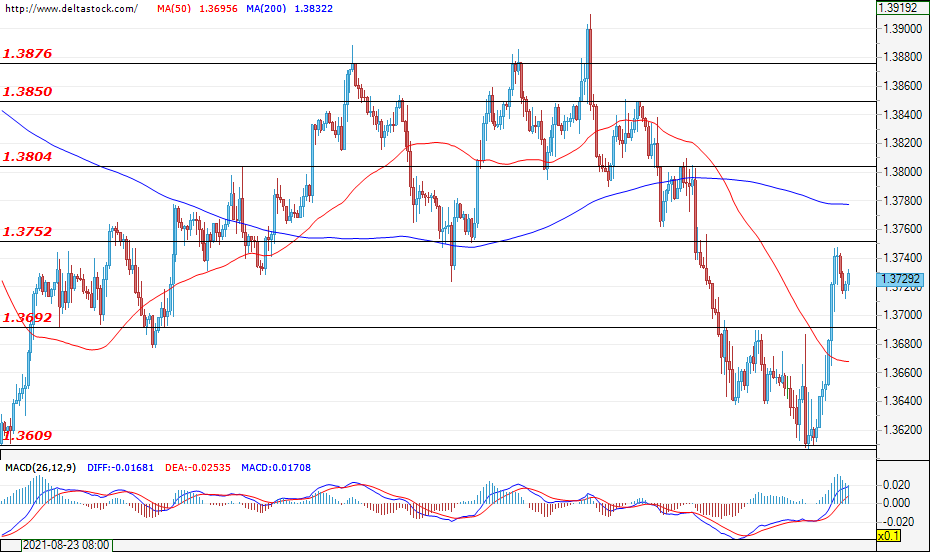
GBP/USD
Current level – 1.3730
The sterling appreciated against the U.S. dollar and reached the resistance at 1.3750. The bulls gained enough momentum and managed to gain control of the market and, at the time of writing, the pair is trading just below the mentioned significant resistance. A breach of this level would pave the way for the currency pair towards a test of the next resistance at 1.3800. If the bears enter the market and manage to breach the support at 1.3692, then a test of the next support level at 1.3600 will become likely.
| Resistance | Support | ||
| intraday | intraweek | intraday | intraweek |
| 1.3750 | 1.3850 | 1.3700 | 1.3500 |
| 1.3804 | 1.3870 | 1.3600 | 1.3450 |