
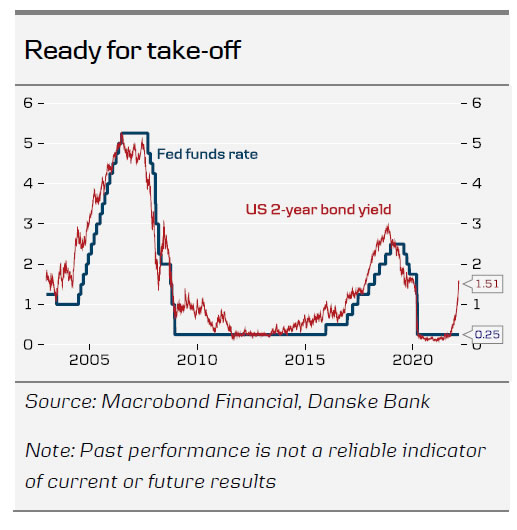
With a Fed hiking cycle starting soon, we look at what previous hiking cycles looked like and how the current situation compares. In a coming paper we will look at how markets have fared during previous hiking cycles and what to expect in this cycle.
We see some key differences in the current situation compared to previous hiking cycles. Most importantly, the Fed looks to be a lot behind the curve, which calls for more front-loaded tightening than normal.
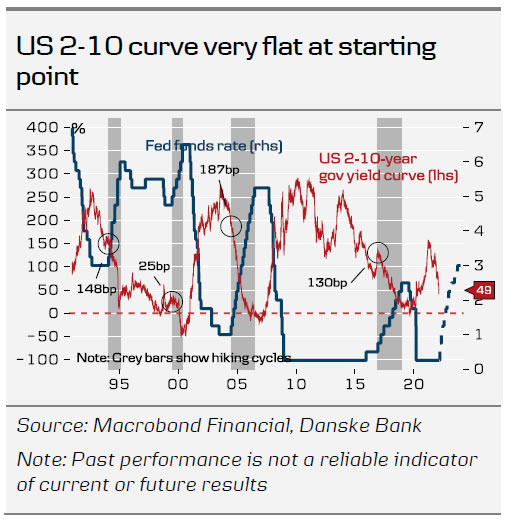
Another key difference important for not least bond markets is, that the yield curve is unusually flat in comparison with previous rate take-offs. We thus expect to see outright selling of bonds by the Fed (‘active’ QT) as part of the tightening in order to postpone an inversion.
This is unchartered territory for hiking cycles and in our view adds upside risk to long bond yields. It also supports the case for higher risk premia in risk markets.
Stylized facts about hiking cycles
When looking at the previous hiking cycles, we choose to only include the past 30 years as for example inflation expectations were much less anchored before that (see chart). It provides us with four hiking cycles in total 1994-95, 1999-2000, 2004-06 and 2016-2018). The chart on page 2 shows the cycles with stats on length, hikes per year etc. Here is a summary of the key findings:
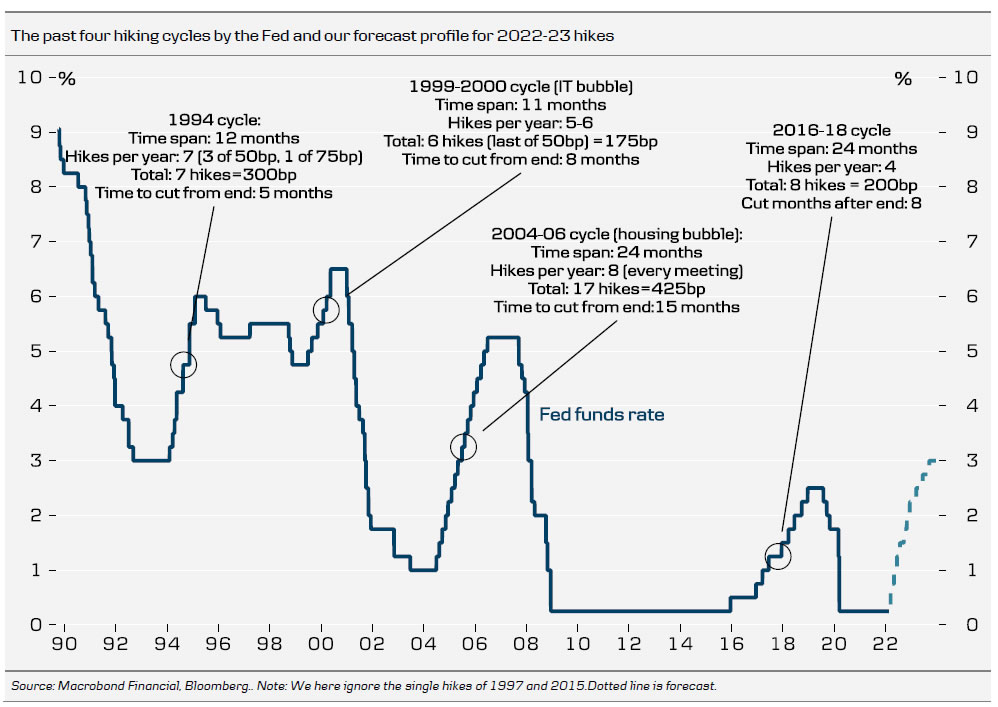
- Hiking cycles have lasted 1-2 years (longest was 24months, shortest 11 months)
- Policy rates were cut within 8 months from the last hike in three cases and 15 months after in one case (2004-06 cycle). In two of the four cycles, the US was in recession within a year from the last hike. In both cases, though, it followed asset bubbles (in 2001 the IT bubble and in 2007 the housing bubble).
- It is more than 20 years ago the Fed has hiked rates by 50bp (changes of 50bp are much more common in rate cut cycles).
- The Fed has not started a hiking cycle with 50bp since the 1980’s.
- The most recent 2016-18 cycle was the ‘softest’ path. The Fed hiked four times per year and 25bp at each meeting (we here ignore the lonely hike in December 2015).
- The 2004-06 hiking cycle was the longest. It lasted 25 months and the Fed hiked 25bp at each meeting for 17 meetings in a row. They described it as ‘measured pace’.
- The shortest cycle was the 1999-2000 cycle that lasted 7 months (total hikes of 175bp).
How the starting point of the current cycle differs from previous cycles
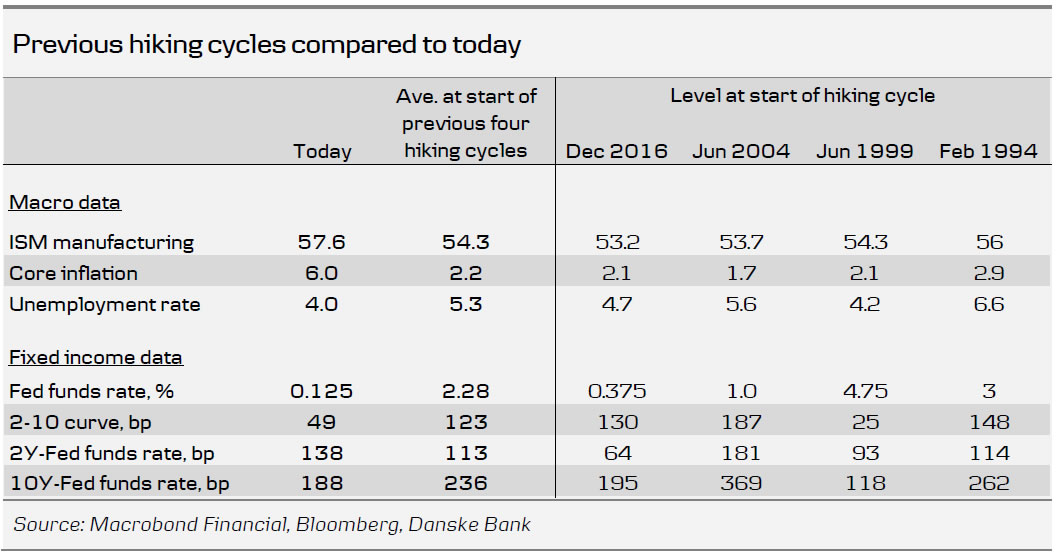
In the table on page 3, we compare the current situation with the starting point of previous hiking cycles in terms of the economy and fixed income markets. Some key differences sticks out:
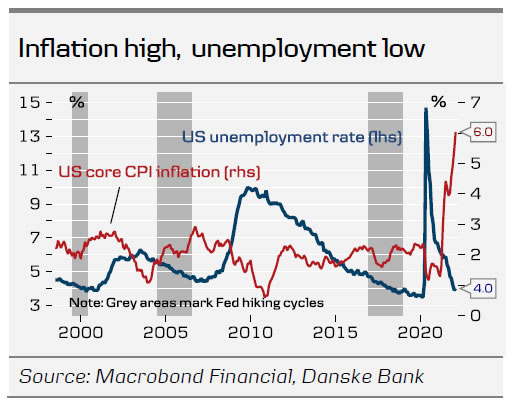
First, it is clear that the Fed this time takes action much later than usual and surely looks to be behind curve (this was also highlighted in Fed Update – We expect a total of 200bp this year starting with 50bp in March, 14 February 2022). Compared to previous cycles, core inflation is much higher, unemployment is lower and ISM manufacturing is higher, see also Fed Update – Different economy, different hiking cycle – a comparison with December 2015, 3 February 2022. In the Fed’s defence, the situation has been extraordinary due to the pandemic and inflationary pressures were underestimated by most forecasters, including ourselves. In addition, employment is still 2% below the level before the pandemic suggesting labour markets have not healed despite labour shortages. However, the Fed no longer has the luxury of being patient with inflation overshooting every month and unemployment now at very low levels. It also seems increasingly likely that permanent damage has been done to potential GDP with fewer workers returning to the labour force than expected.
Second, the Fed is starting from the lowest level ever as rates are close to zero. The Fed did hike from a similar level in December 2015 but it turned out to be a lonely hike and in hindsight looks like a policy error. We have not included it here as it never became an actual cycle.
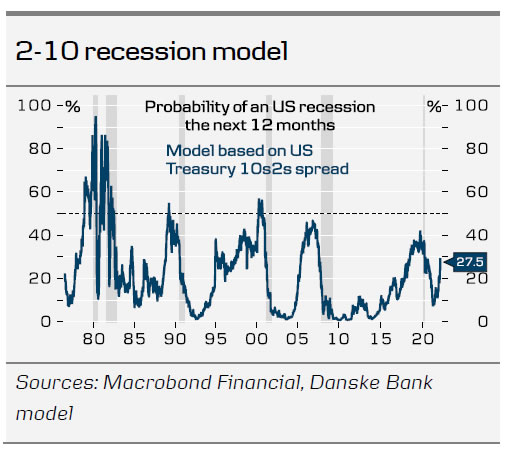
Third, the 2-10 curve (around 46bp currently, is very flat compared to the start of previous cycles. During the past 30 years the curve was only more flat at the start of a hiking cycle in 1999 (25bp) but back then, the cycle also started with the Fed funds rate at 4.75%. In 2004 the 2-10 curve was at 187bp when the first hike was delivered and in 2016 it was at 130bp.
Implications of the different starting point
We believe these differences has some important implications for this hiking cycle:
- The hiking cycle should be more front-loaded in order for the Fed to catch up with what it is behind the curve. This is why we look for the Fed to begin the cycle with a 50bp hike (for the first time since the 1980’s) and follow through with hikes at every meeting in 2022. It is around 50bp more hikes than what the market is currently pricing.
- ‘Active quantitative tightening (QT)’ will, in our view, be seen for the first time ever. That is, the Fed is likely to sell bonds outright to reduce the balance sheet, starting in May in our view. In the previous hiking cycle, the Fed only did what we call ‘passive QT’ and reduced the balance sheet by not reinvesting proceeds from bonds that expired. Without ‘active QT’ the Fed could very well see an inversion of the 2-10 curve very early in the hiking cycle, because the starting point is a very flat curve to begin with. An inversion has historically been a leading indicator of recession and we believe the Fed will aim to postpone an inversion as long as possible. Several FOMC members have already expressed concern over a possible inversion. They can work to avoid this by selling longer bonds.
The above features highlights that we are indeed entering unchartered territory when it comes to Fed tightening cycles. We will follow up soon with a paper on what the financial implications are likely to be but all else equal, we see a case for more upward pressure on longer yields on the back of ‘active QT’ and for higher risk premia in risk assets because of the unchartered path the Fed is embarking on.


