
Gold price is moving lower below the $2,025 support. Crude oil price is correcting gains and might decline toward the $68.85 support.
Important Takeaways for Gold and Oil Prices Analysis Today
- Gold price failed to clear the $2,060 resistance and corrected gains against the US Dollar.
- It broke a key contracting triangle with support near $2,025 on the hourly chart of gold at FXOpen.
- Crude oil prices are also moving lower below $72.00 and $71.50 levels.
- There was a break below a major bullish trend line with support near $73.00 on the hourly chart of XTI/USD at FXOpen.
Gold Price Technical Analysis
On the hourly chart of Gold at FXOpen, the price traded to a new all-time high before it started a downside correction. The price declined below the $2,060 level to move into a bearish zone.
The last swing high was near $2,048 and the price is now trading below the 50-hour simple moving average. It traded below a key contracting triangle with support near $2,025. The price is now trading below the 61.8% Fib retracement level of the upward move from the $1,999 swing low to the $2,048 high.
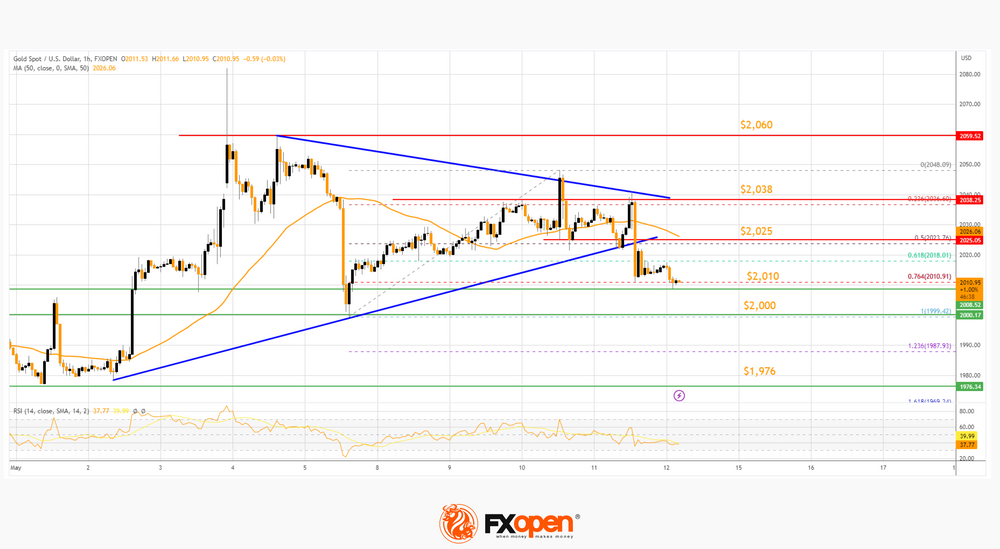
Initial support on the downside is near the 76.4% Fib retracement level of the upward move from the $1,999 swing low to the $2,048 high at $2,010.
The first major support is near the $2,000 level. The main support sits near the $1,976 level. If there is a downside break below the $1,976 support, the price might decline heavily.
The next major support is near $1,955, below which the bulls could aim for a test of $1,932. On the upside, the bulls are facing resistance near the 50-hour simple moving average at $2,025. The next major resistance is near the $2,038 level.
An upside break above the $2,038 resistance could send Gold price toward $2,060. Any more gains may perhaps set the pace for an increase toward the $2,080 level.
Oil Price Technical Analysis
On the hourly chart of WTI Crude Oil at FXOpen, the price struggled to recover further above the $74 resistance against the US Dollar. A high was formed near $73.79 and there was a downward move.
There was a break below a major bullish trend line with support near $73.00. The price declined below the 50-hour simple moving average at $72 and RSI dropped to 30. It is now showing bearish signs below the 23.6% Fib retracement level of the upward move from the $63.90 swing low to the $73.79 high.
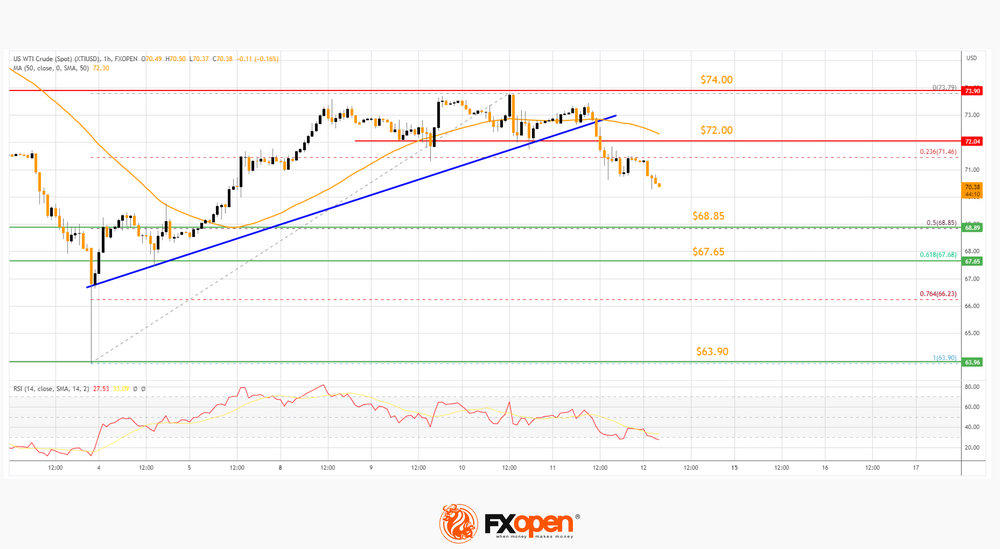
On the downside, support is near the 50% Fib retracement level of the upward move from the $63.90 swing low to the $73.79 high at $68.85.
The next major support on the WTI crude oil chart is near $67.65. If there is a downside break, the price might decline toward $63.90. Any more losses may perhaps open the doors for a move toward the $60.00 support zone.
On the upside, the price could struggle near the 50-hour simple moving average at $72.00. The first major resistance is near the $74.00 zone, above which the price might accelerate higher toward $76.00. Any more gains might send the price toward the $80.00 level in the coming days.


