
Key Highlights
- Gold is attempting a fresh increase from the $2,350 support zone.
- It cleared a connecting bearish trend line with resistance at $2,388 on the 4-hour chart.
- Oil prices extended losses and traded below $75.50.
- The US ADP employment could change by 150K in July 2024.
Gold Price Technical Analysis
Gold prices found support near the $2,352 level against the US Dollar. The price formed a base and recently started a recovery wave above $2,365.
The 4-hour chart of XAU/USD indicates that the price settled above the $2,380 level and the 200 Simple Moving Average (green, 4 hours). It cleared a connecting bearish trend line with resistance at $2,388.
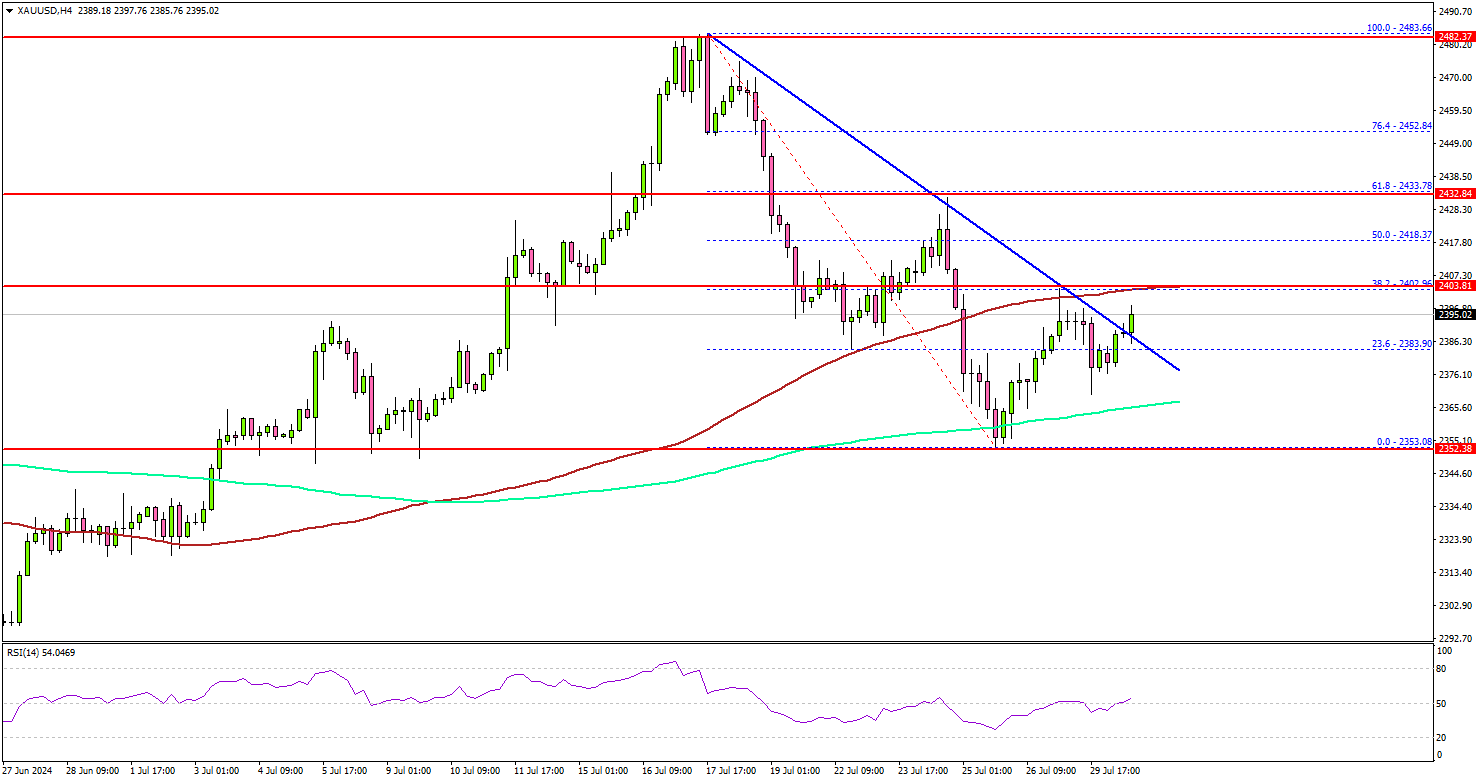
The price surpassed the 23.6% Fib retracement level of the downward move from the $2,483 swing high to the $2,353 low. The price is now facing resistance near the $2,400 zone and the 100 Simple Moving Average (red, 4 hours).
The next major resistance sits near the $2,420 level and the 50% Fib retracement level of the downward move from the $2,483 swing high to the $2,353 low.
A clear move above the $2,420 resistance could open the doors for more upsides. The next major resistance could be near $2,432, above which the price could accelerate higher toward the $2,445 level. Any more gains might send Gold toward the $2,450 resistance.
On the downside, there is a key support forming near the $2,365 level and the 200 Simple Moving Average (green, 4 hours). A downside break below the $2,365 support might call for more downsides. The next major support is near the $2,352 level. Any more losses might send gold prices toward $2,340.
Looking at Oil, the bears remained in action and they might soon aim for more downsides below the $75.00 support region.
Economic Releases to Watch Today
- US ADP Employment Change for July 2024 – Forecast 150K, versus 150K previous.
- US Pending Home Sales for June 2024 (YoY) – Forecast +1.1%, versus -6.6% previous.


