
Key Highlights
- WTI Crude Oil prices started a fresh decline below the $65.00 zone.
- A connecting bearish trend line is forming with resistance at $65.00 on the 4-hour chart.
- Gold could attempt a fresh increase if it clears the $3,385 resistance.
- Ethereum price rallies further above the $4,650 and $4,700 levels.
WTI Crude Oil Price Technical Analysis
WTI Crude Oil price struggled above $66.50 against the US Dollar. There was a decline below the $65.50 and $65.00 support levels.
Looking at the 4-hour chart of XTI/USD, the price settled below the $65.00 level, the 100 simple moving average (red, 4-hour), and the 200 simple moving average (green, 4-hour). The bears even pushed the price below $63.20.
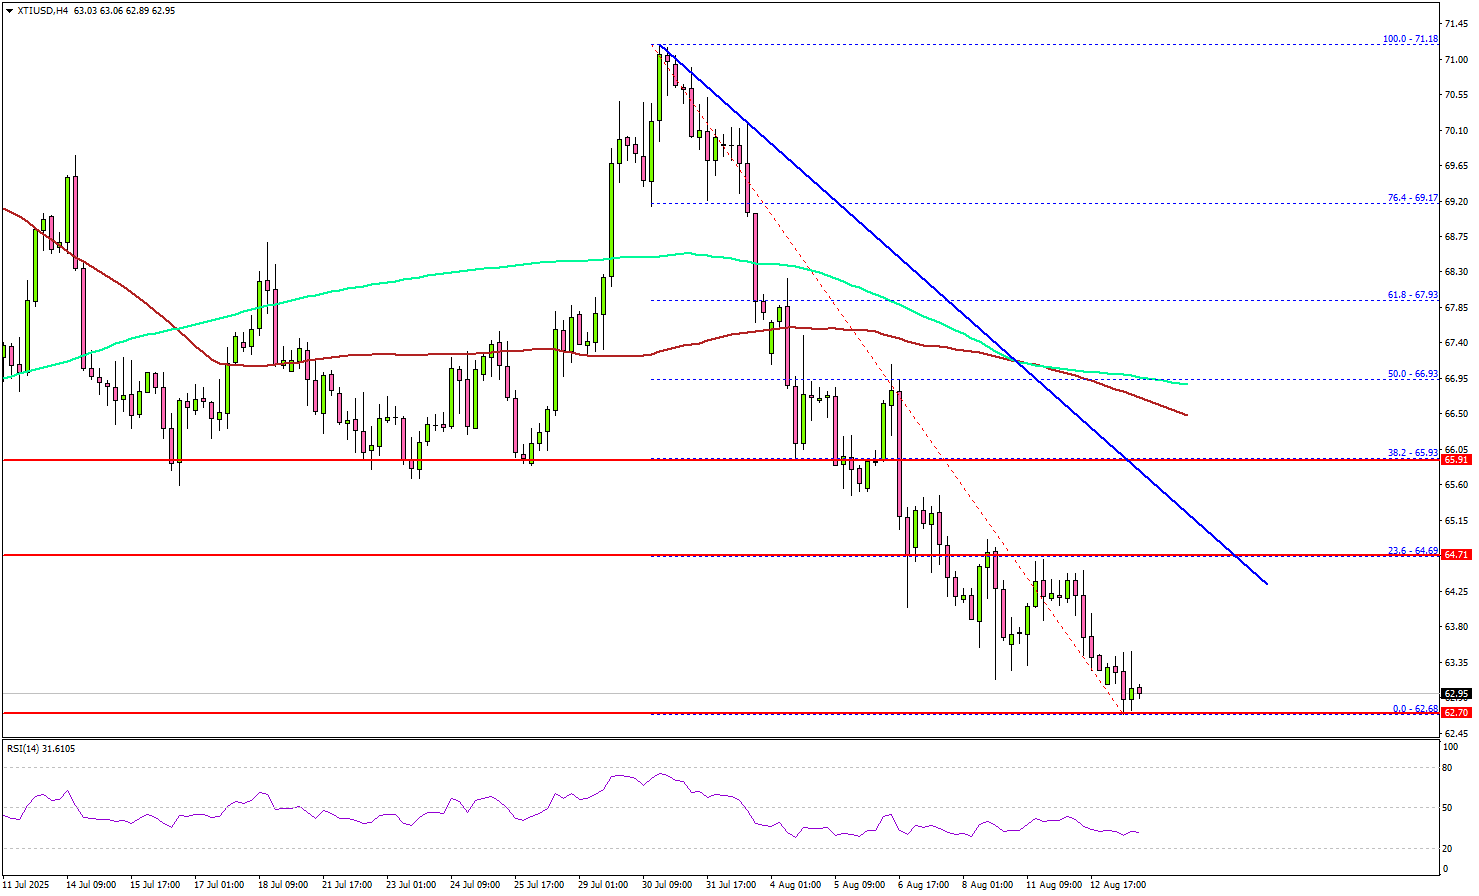
Finally, the price tested the $62.65 zone and recently started a consolidation phase. On the upside, immediate resistance is near the $64.50 level or the 23.6% Fib retracement level of the downward move from the $71.18 swing high to the $62.68 low.
The first key resistance sits near the $65.00 level. There is also a connecting bearish trend line forming with resistance at $65.00. The main hurdle is now near the $65.90 zone, above which the price may perhaps accelerate higher.
In the stated case, it could even visit the 100 simple moving average (red, 4-hour) at $66.50. Any more gains might call for a test of $68.00 in the near term.
On the downside, the first major support sits near the $62.65 zone. The next support could be $61.50. A daily close below $61.50 could open the doors for a larger decline. The next major support is $60.00. Any more losses might send oil prices toward $58.00 in the coming days.
Looking at Gold, the bulls are slowly regaining strength and might soon aim for a move above the $3,385 resistance zone.
Economic Releases to Watch Today
- US Initial Jobless Claims – Forecast 224K, versus 217K previous.
- US Producer Price Index for July 2025 (MoM) – Forecast +0.2%, versus 0% previous.
- US Producer Price Index for July 2025 (YoY) – Forecast +2.5%, versus +2.3% previous.


