
All eyes are laying on one asset class in Markets: Precious Metals
The usual suspect: Gold, A.K.A. The Bullion (or just “bully” for people who are caught short).
Gold has always been a very complex asset. It does not have a face value yet it serves as store of value for many Central Banks. It cannot be eaten yet people always starve for it.
And these days, it not-only is at the center of the 2025 Trump-Administration deglobalization theme but also a good edge against every potential catalyst against positive sentiment this year:
Rate cuts? Wars? Fiscal catastrophes? Political instability (France, Japan, US, UK, …)
Bonds haven’t seen much demand since the end of the 2022 hike cycle and stocks are at all-time highs, therefore the question is more one of currency-debasing rather than a purely risk-off Market.
Metals had been stabilizing and correcting from their relative highs as war situations seemed to be resolving, central banks had cut their purchases and a signs of higher-than-projected inflation pushed the FOMC to hold their rates higher (typically negative for Gold as a non-yielding assets).
However, Markets had calmed from their higher term overbought conditions. The latest change in Powell’s tone at Jackson Hole followed by an increasingly compromised FED Independence led to a massive rebound in metals, propulsed by both Gold and Silver.
Let’s attack a high to intraday timeframe analysis for Gold as it keeps breaking records, and identify levels of interest.
Multi-timeframe analysis for Gold, starting from the Weekly to intraday
Gold Weekly timeframe
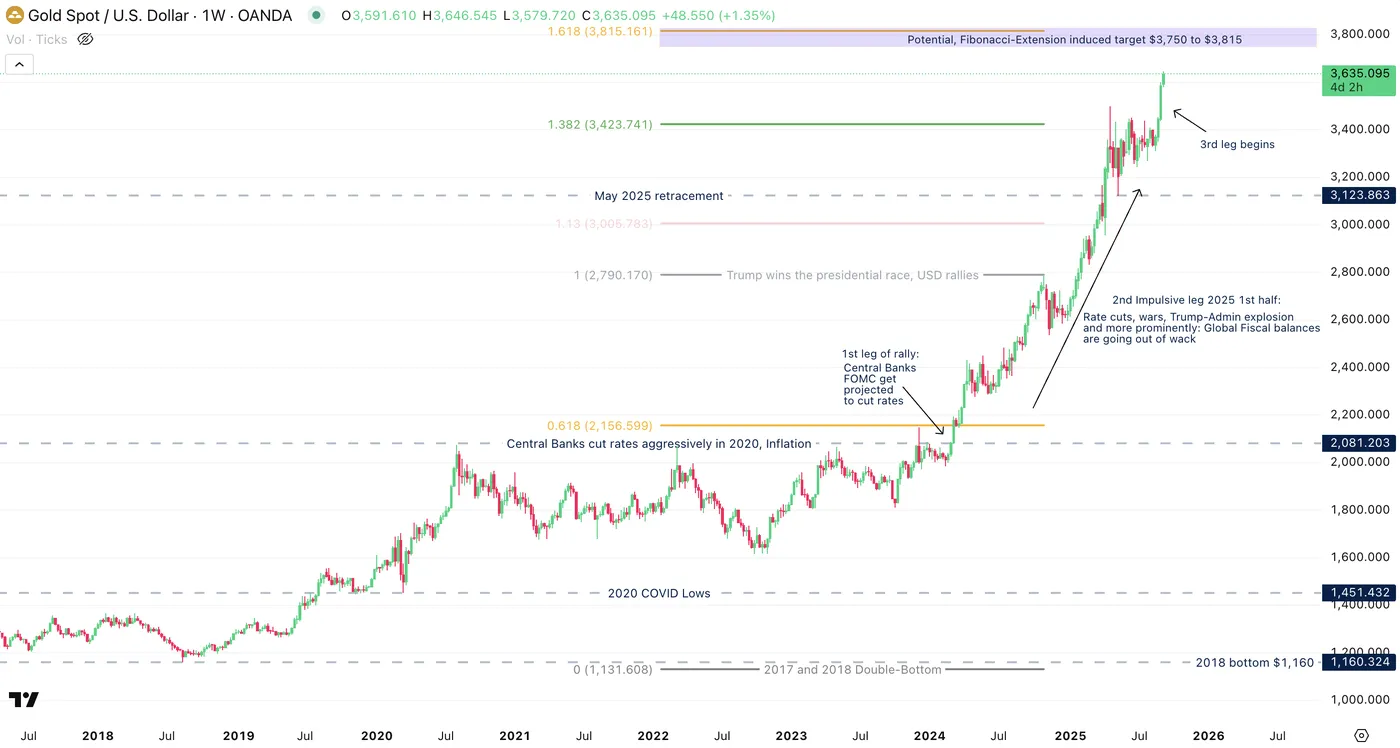
Gold Weekly Chart, September 2025, Source: TradingView
Taking a look back to the weekly charts really helps to see how significant this ongoing move in Gold is.
Some key levels and their significant events point to what trends or themes helped Gold to rally so much and actually find its own local tops.
The latest one, leading to a consolidation between May to end-August 2025 was due to uncertainty on the real impact of tariffs. They hadn’t seemed to hurt economies yet, particularly the US and conflicts were resolving at the same time (Israel-Iran, easing conflict in Eastern Europe… This one aged like fine milk).
The current move seems to form a typical 3 legged impulsive move with the 3rd one starting most recently. Elliott Wave analysis, which is very useful to evaluate trending markets, helps to check the state of a current trend and the usual 3rd impulsive tends to be the final one.
The one question is: Where and how could it stop?
There’s an infinity of potential answers but some key changes of theme would be necessary: A more restrictive US balance sheet, forcing other governments to do the same; conflicts resolving, particularly the ongoing technology cold-war between the occident (G7) and the orient (Russia, China) or more simply a re-globalization; Finally, Central Banks Independence (i.e. the FOMC) being able to reborn.
Gold Daily Chart
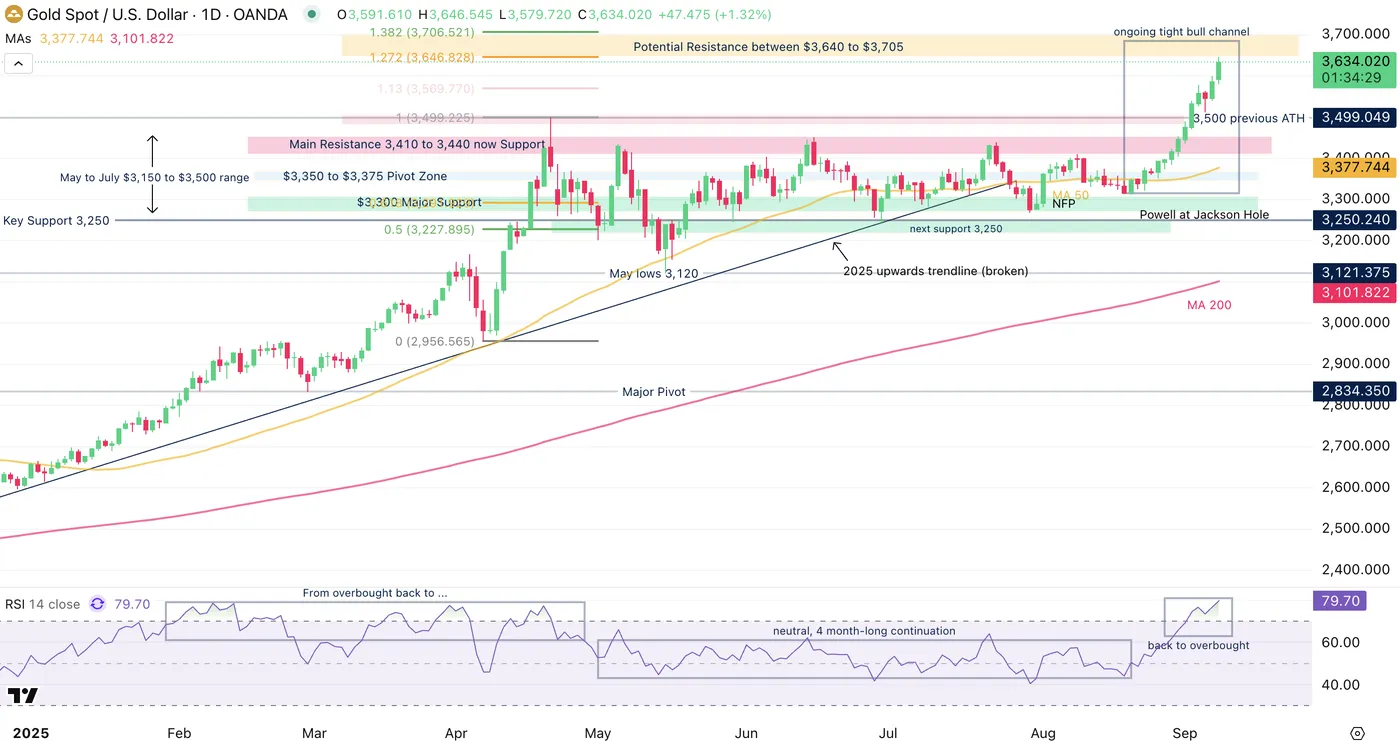
Gold Daily Chart, 8 September 2025, Source: TradingView
There is a lot to see on this daily chart but focus on these few elements:
The technical uptrend from October 2024 into the April 22nd 2025 $3,500 top in overbought conditions led to a 4-month consolidation which took the RSI back to neutral and now, the ongoing up-trend is heading back to overbought.
Remember that overbought don’t mean a top, particularly in such strong trends: A tight bull channel (no red candle closing below the prior green) shows that the current price discovery is one of bullish dominance.
Any such bear candle may attract further mean-reversion.
However, some wicks are appearing after today’s bull candle as the first Fibonacci-induced targets (Yellow Zone) is getting reached.
The timing coincides with Markets needing to know if the FOMC cut will be a 25 bps (consolidation/slight selloff in Gold ceteris paribus) or a 50 bps (dovish FED = metals keep flying).
Levels of interest for Gold trading:
Support:
- $3,400 to $3,500 past ATH Zone, Now Pivot/Support
- $3,300 Major Support
- $3,000 Main psychological level
Resistance and potential technical targets (due to all-time highs, can only use potential targets):
- Current session highs and ATH $3,646
- Fibonacci-Extension 1 from April Lows to April highs ($3,640 to $3,705) (yellow square)
- Potential, Fibonacci-Extension 2 from 2018 to Oct 2024 induced target: $3,750 to $3,815 (Purple square on Weekly)
Gold 4H Chart
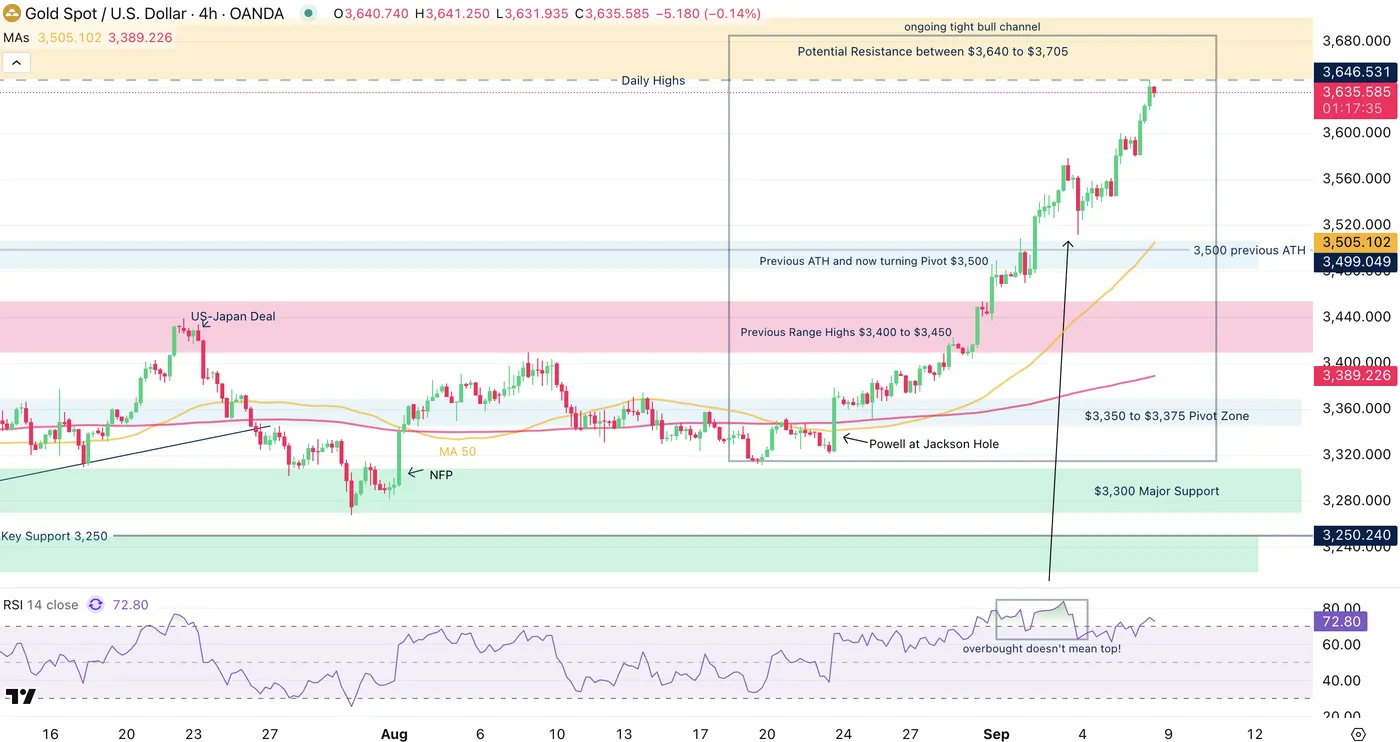
Gold 4H Chart, 8 September 2025, Source: TradingView
One highlight of this 4H intraday chart is to see how small reversals don’t imply bigger trend reversals. Generally, longer term reversals show signs of forming and (tend to) start with a slowdown in the trend, except for a fundamental black swan.
We are however reaching a potential fib-target, which may imply some slowing in the buying in the waiting of US Inflation data – Do consider that the tight bull channel is still active.
Safe Trades!


