
Markets just received the Canadian labor report — and unlike the still-missing U.S. one (thanks, government shutdown), this one actually delivered. Canada added +60K jobs vs. +5K expected, a sharp rebound from last month’s -65K loss.
Even better, most of these gains came from full-time positions, signaling renewed strength in the labor market.
Being bullish on the CAD hasn’t been a winning trade this year. It’s been one of the top underperformers in FX—now only slightly ahead of the even weaker JPY—caught in the middle of a challenging macro backdrop.
As a cyclical economy, Canada cooled rapidly after its huge 2022–2023 period.
The job market softened, real estate activity slumped, and slower immigration weighed further on overall growth. Combined with tensions between Ottawa and the Trump-Administration regarding US-Canada trade, the outlook for the loonie had been anything but bright.
Oil prices (One of Canada’s top export, linked to CAD performance) trending down to 5-year lows also haven’t helped the Maple Dollar much.
WTI Oil actually just dipped below $60 – this may hurt US Shale producers even further and hence have less of a net-negative effect on the CAD.
Check how well Oil and the Canadian Dollar correlate throughout the years
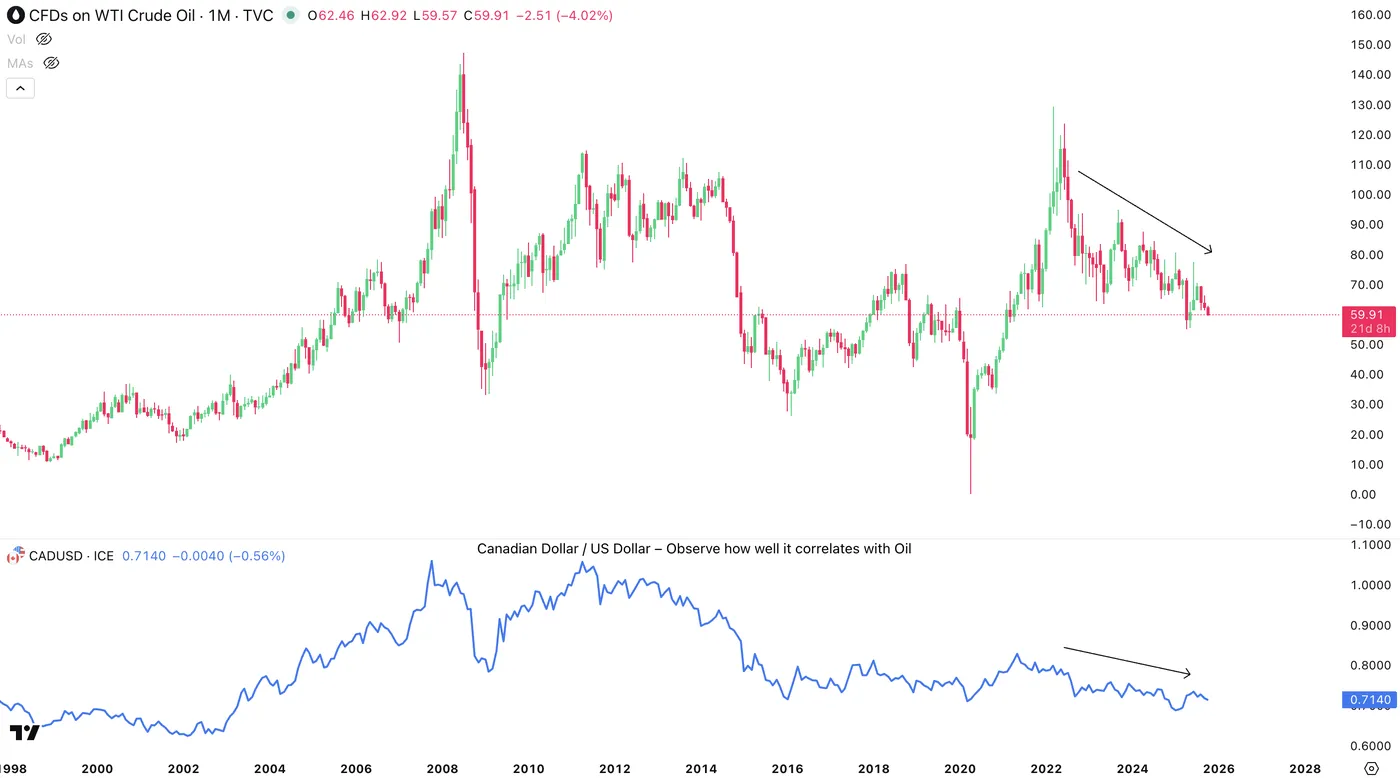
WTI Oil and CAD/USD since 1998, Source: TradingView
But things might be starting to look better
However, the ongoing Trump–Carney talks this week are reviving optimism for improved trade conditions.
Canadian trade envoy Dominic Leblanc described the talks from this week as “successful, positive, substantive”, but markets are still awaiting for decisive news on tariffs, particularly on steel.
With USD/CAD testing and rejecting the 1.40 level, let’s dive into a multi-timeframe analysis to see what comes next.
USD/CAD multi-timeframe analysis
Daily Chart
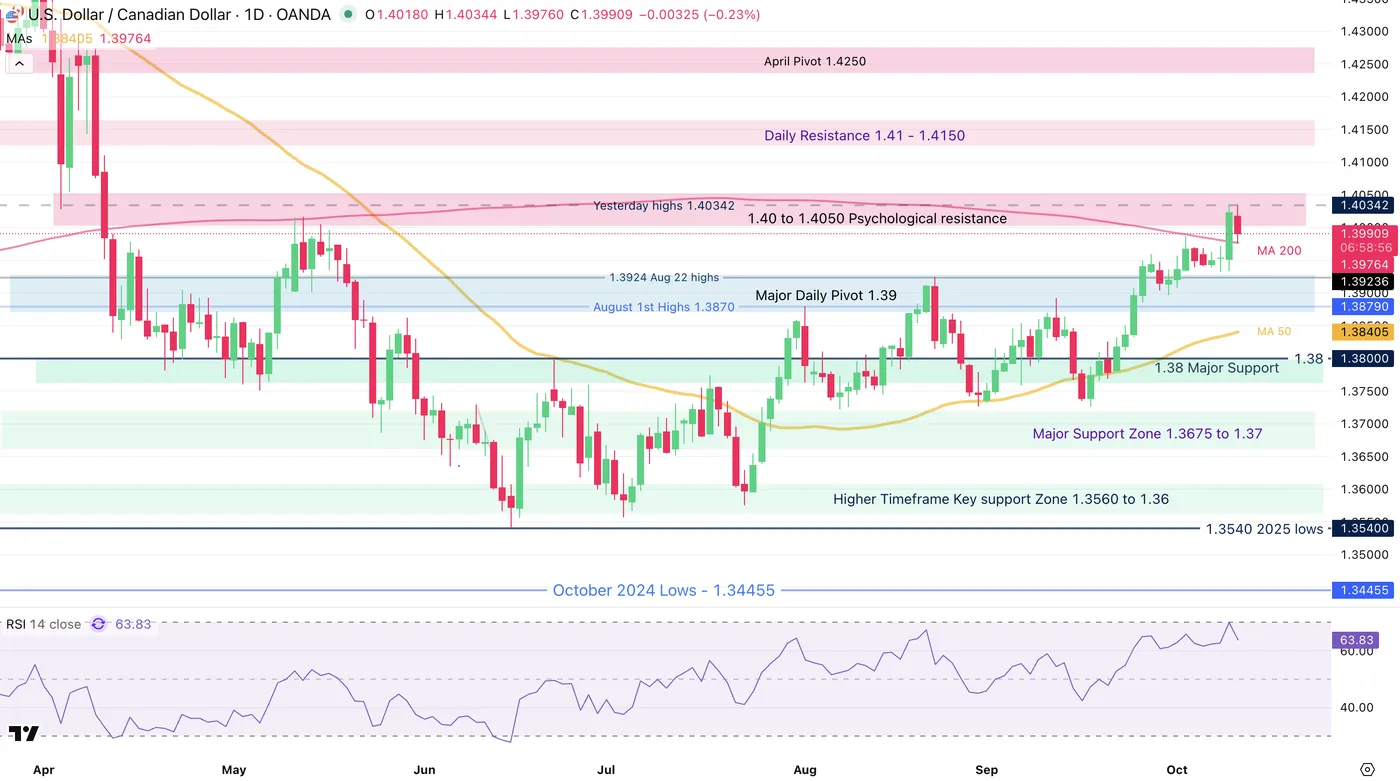
USD/CAD Daily Chart, October 10, 2025 – Source: TradingView
After bearish failure in the pair throughout multiple consolidation periods, USD/CAD has rallied in steps – Initially ranging between 1.36 to 1.38, then 1.37 to 1.39 leading to today.
Some countering elements are blurring the picture looking forward: The price action is bullish, with prices just moving above the 200-Day MA acting as immediate support.
The 1.40 level on the other hand opposes a huge psychological resistance for the pair.
The session and weekly close will be important for the pair: Anything below, traders consider that the trade outlook between US and Canada is not looking too bad.
A close above 1.40 continues the bullish trend to retest April resistances.
4H Chart and levels
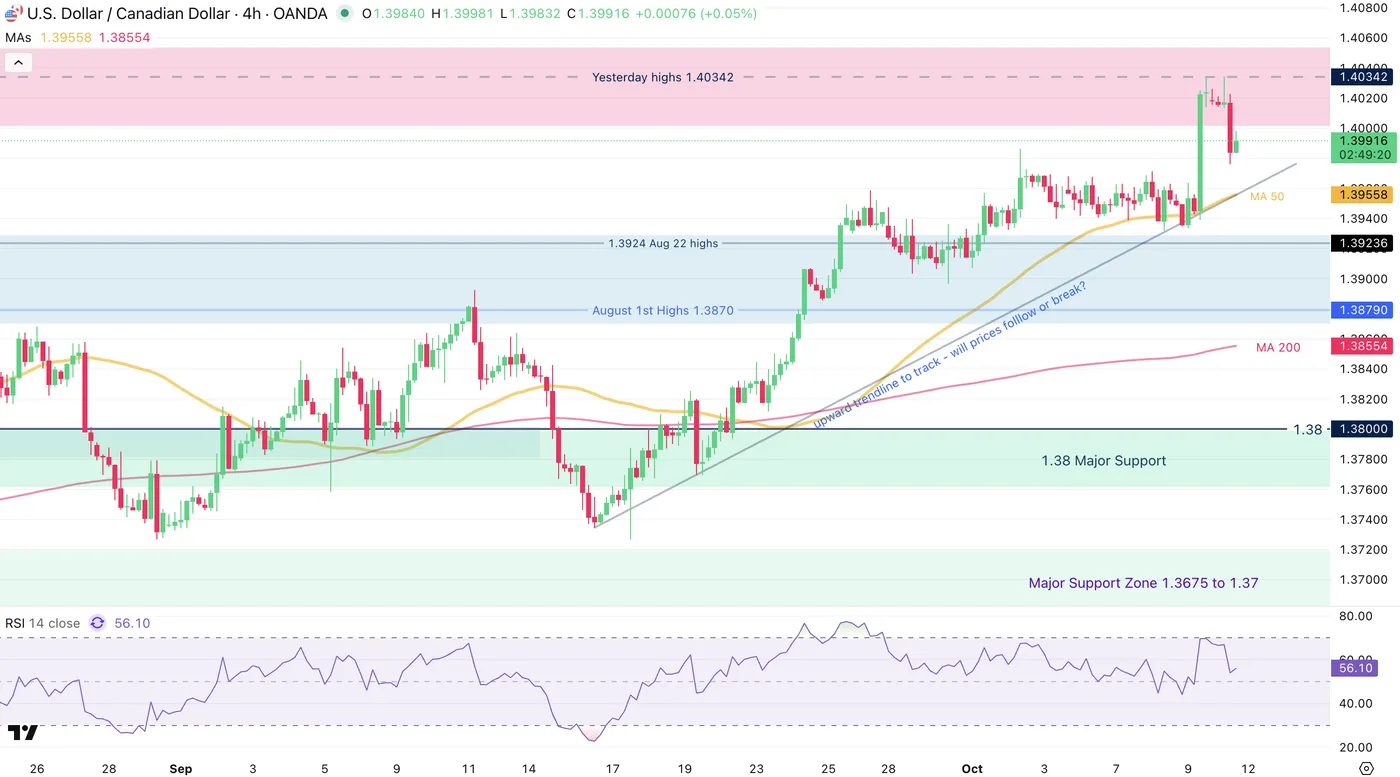
USD/CAD 4H Chart, October 10, 2025 – Source: TradingView
The latest move upward was more due to the broad US Dollar rally than pure Canadian Dollar weakness.
Loonie weakness was at the center of its low performance this year, whcih also invites to look at other CAD pairs for decent opportunities.
One can also track how prices react to a test of the 4H-MA 50 (1.39560) and upward trendline for upcoming trading.
Levels to place on your USDCAD charts:
Resistance Levels
- 1.40 to 1.4050 Psychological resistance
- Yesterday highs 1.40342
- April Resistance 1.41 – 1.4150
- April Pivotal resistance 1.4250
Support Levels
- Major Daily Pivot 1.39
- 200-Day MA 1.39750 (immediate support)
- 1.38 Major Support
- Major Support Zone 1.3675 to 1.37
- 1.3550 Main 2025 Support
1H Chart
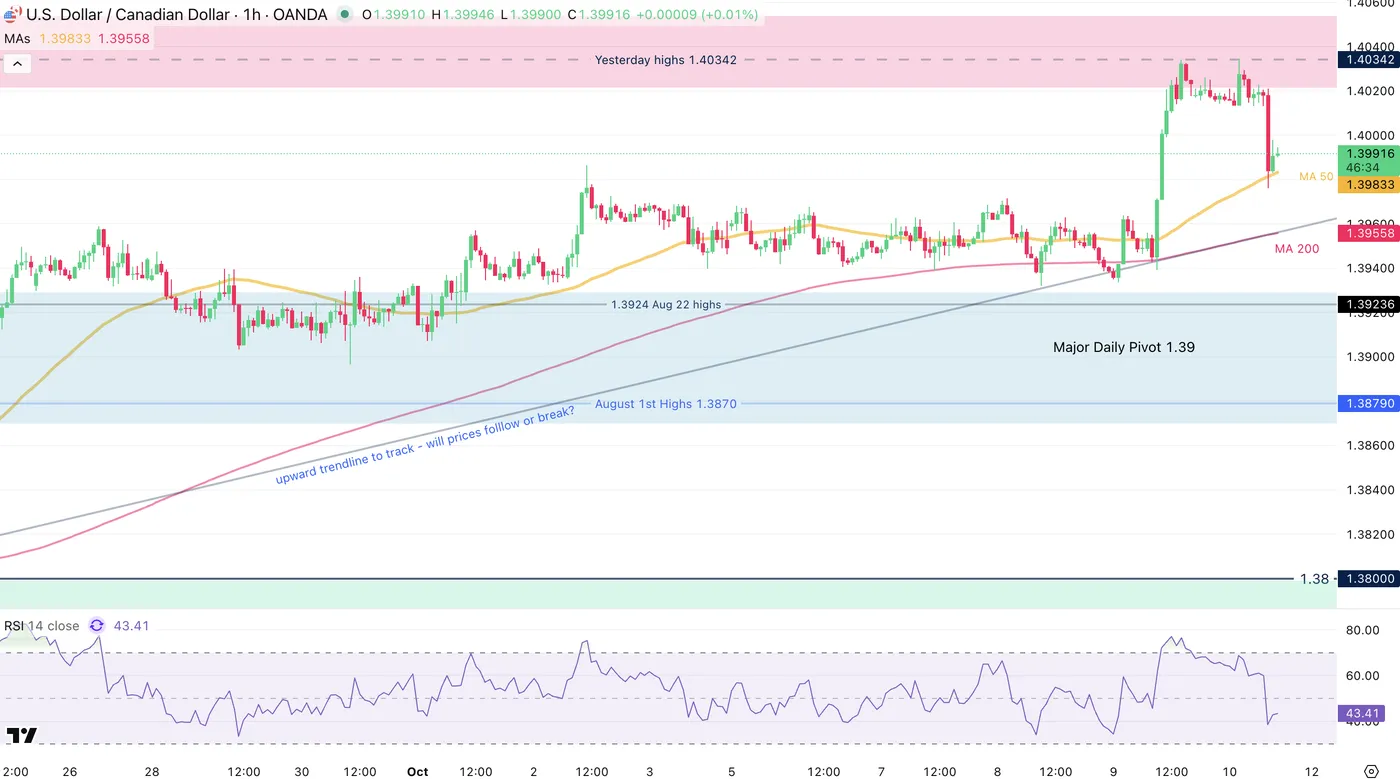
USD/CAD 1H Chart, October 10, 2025 – Source: TradingView
Looking at teh keys to the current price action, USDCAD is in the middle of some key developments.
A break above the weekly highs (1.4030) should turn into a further breakout. Odds of this are increased on a daily close above 1.40.
A break below 1.3550 could accelerate towards the 1.39 Main Pivot, key for future price action.
Any daily close below the zone (1.3880 are the lows) point to a solid re-entry within the 1.36 to 1.39 5-month range.
Safe Trades!


, this one actually delivered. Canada added +60K jobs vs. +5K expected, a sharp rebound from last month’s -65K loss.)