
On Wednesday, silver surged past 66 USD per ounce, setting a new all-time high. The rally was driven by a mixed US employment report, which sparked investor interest in alternative high-return assets for portfolio diversification.
The November labour market data revealed the unemployment rate climbing to 4.6% – its highest level since 2021 – even as job creation exceeded expectations.
Silver’s year-to-date gain of nearly 130% is further supported by declining inventories and robust demand from both retail investors and industrial users. In particular, expanding sectors such as solar energy, electric vehicles, and data centres are driving increased industrial consumption.
Technical Analysis: XAG/USD
H4 Chart:
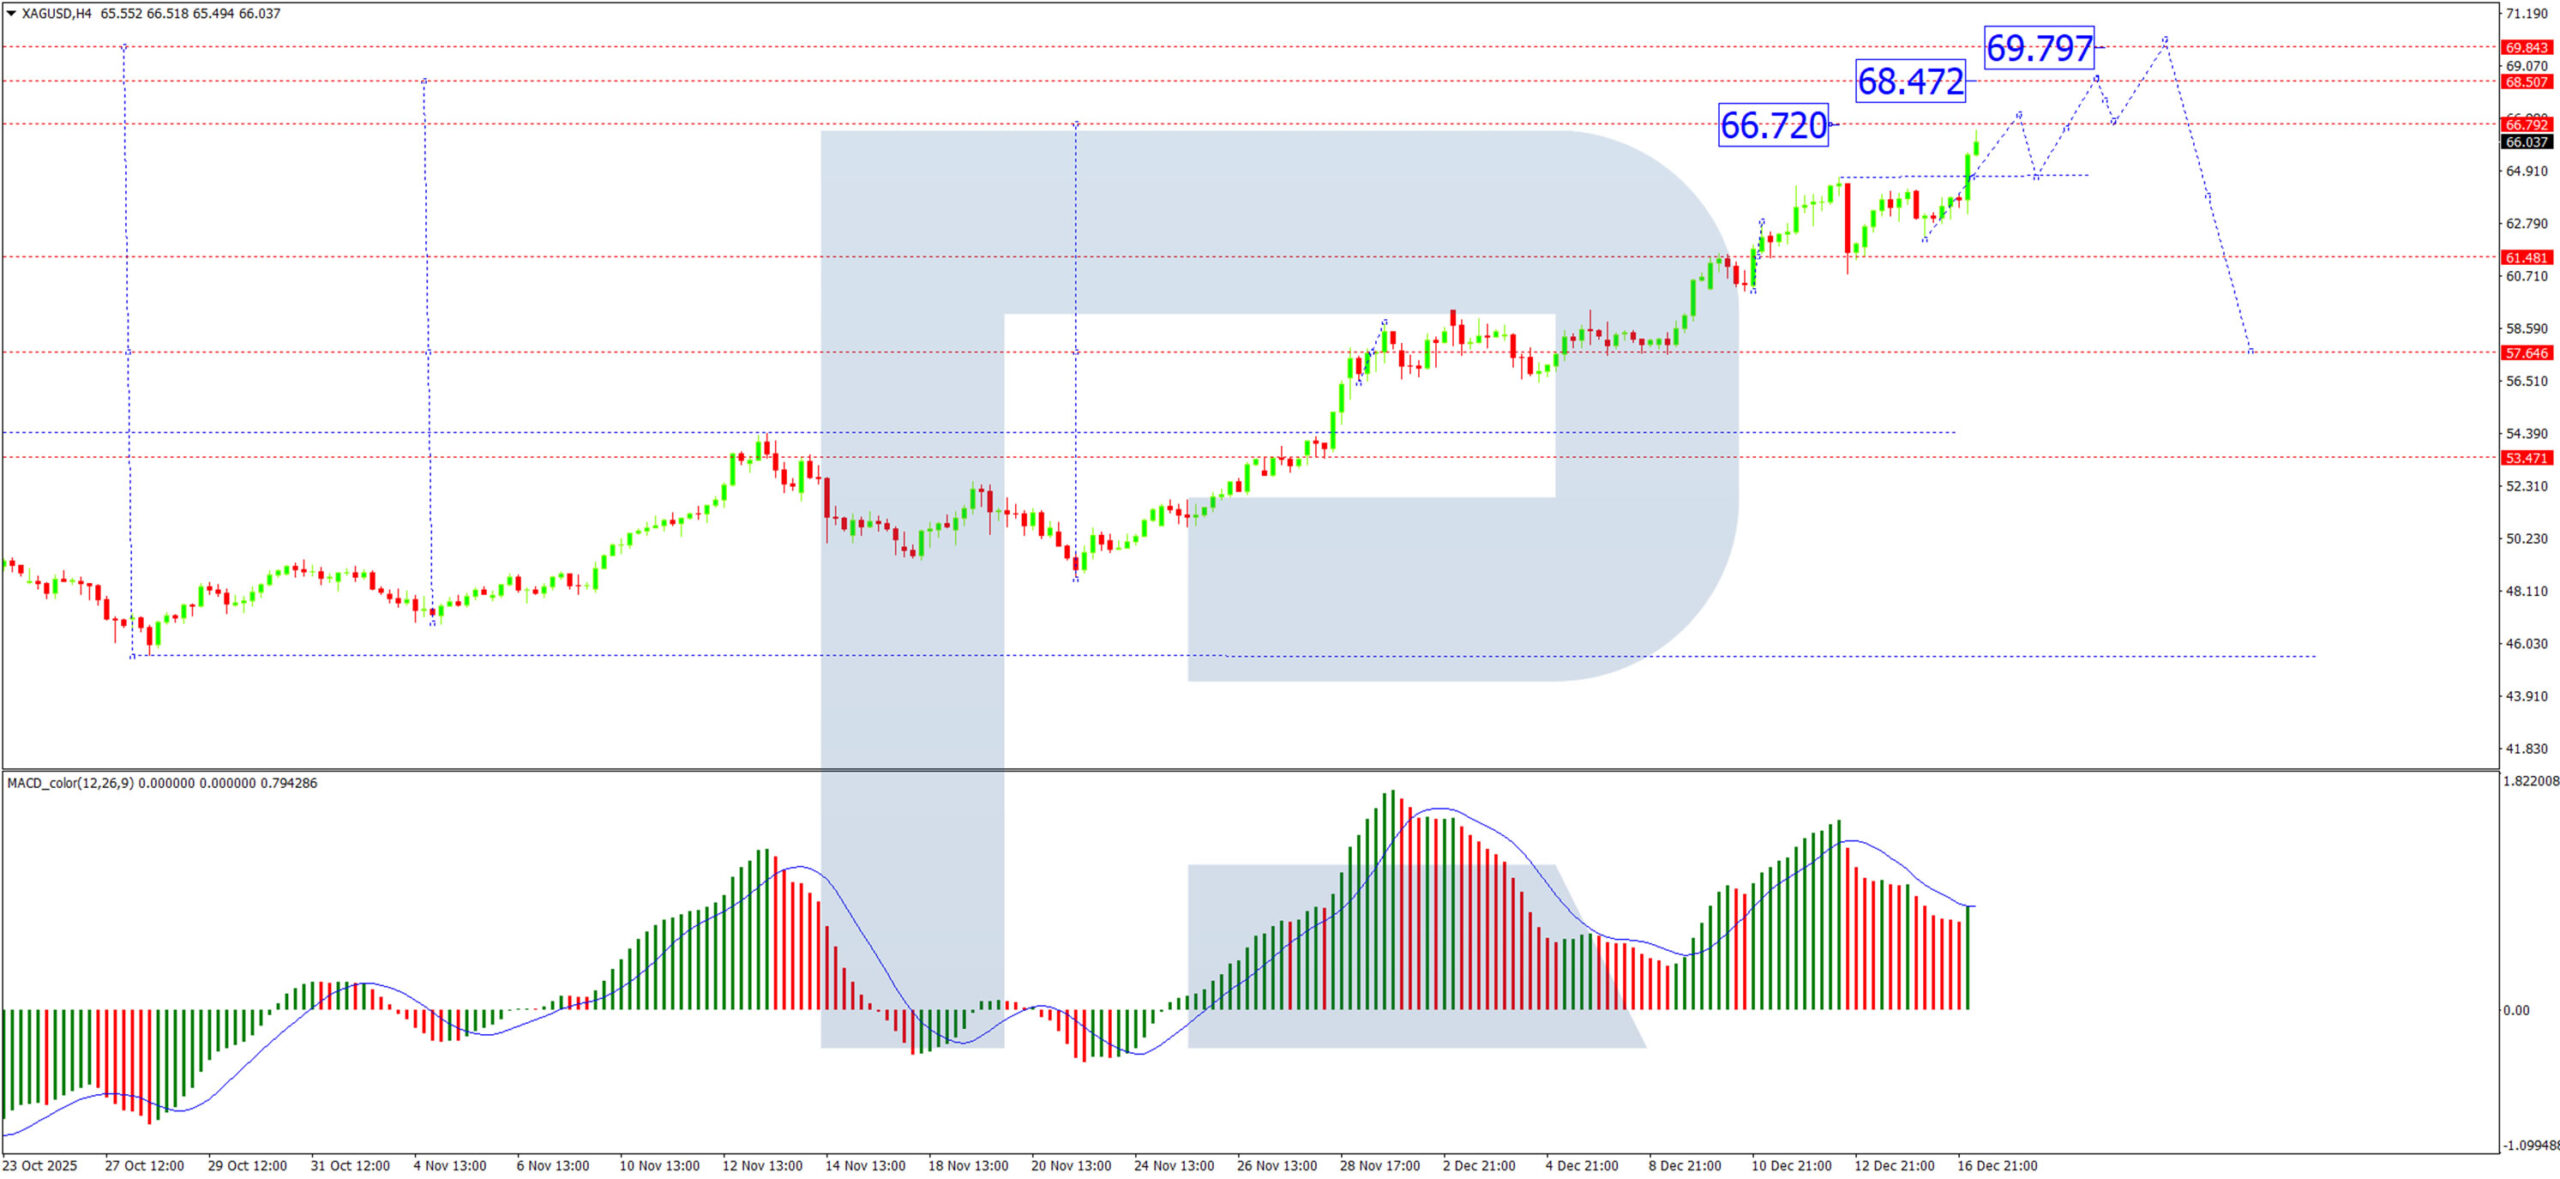
On the H4 chart, XAG/USD established a consolidation range around 57.65 USD. Following an upward breakout, the market has extended to 66.72 USD, with scope for further gains towards 69.79 USD. Having completed a growth impulse to 66.51 USD, a minor correction towards 64.64 USD appears possible before the uptrend resumes.
The MACD indicator supports the bullish outlook, with its signal line firmly above zero, indicating sustained upward momentum.
H1 Chart:
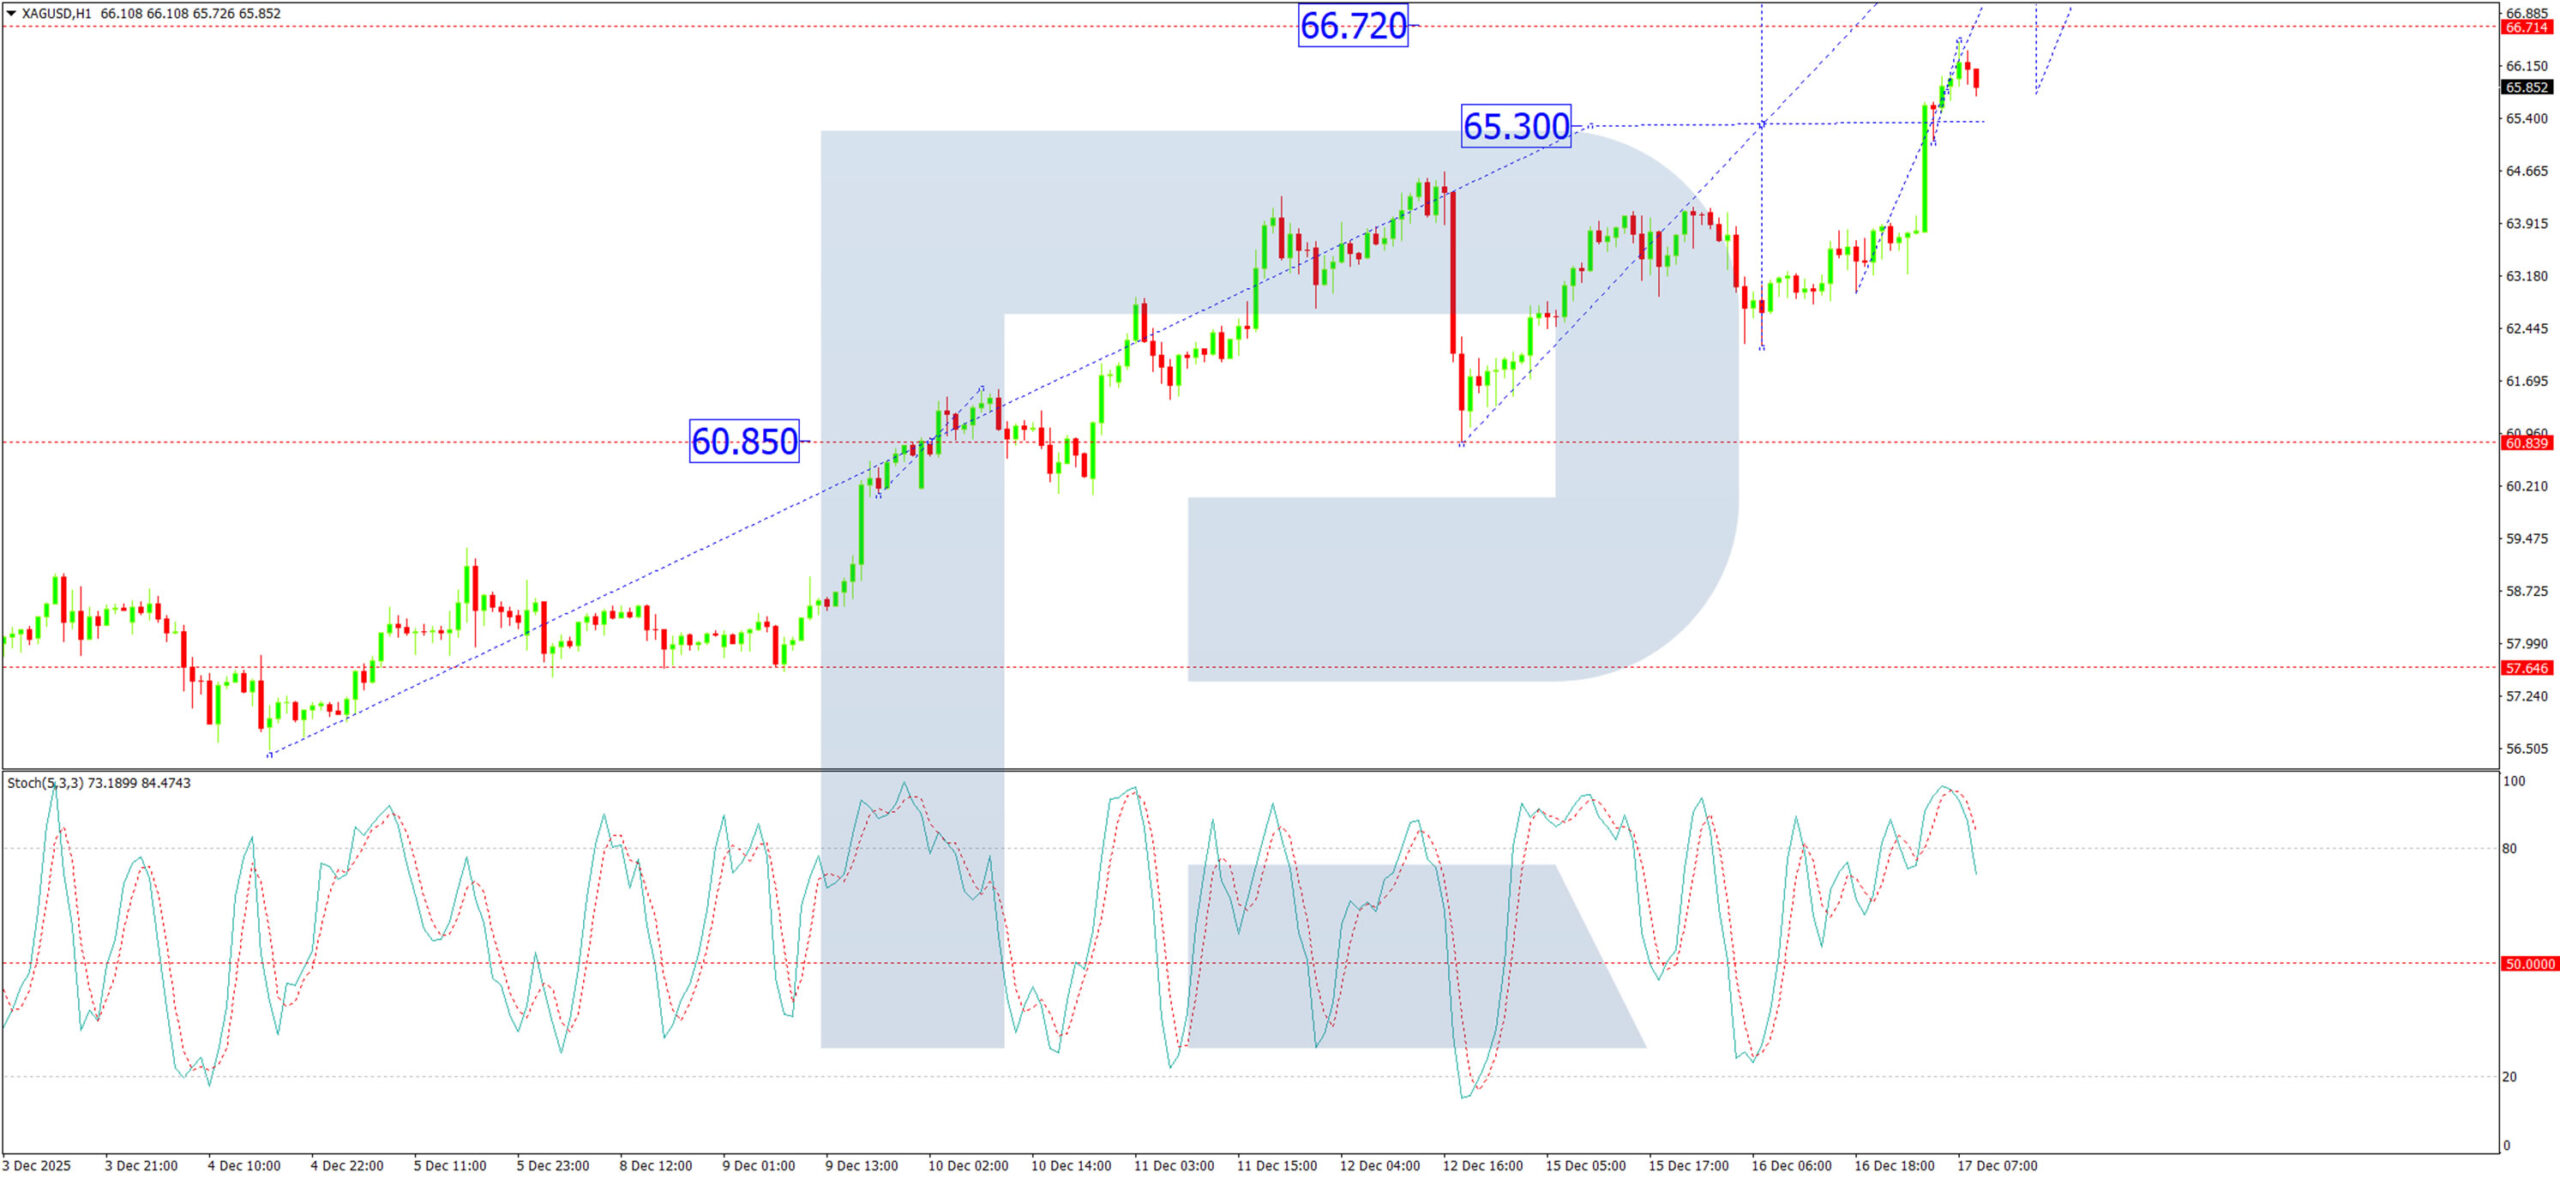
On the H1 chart, silver completed a growth wave to 65.30 USD and has since formed a consolidation range around this level. An upward breakout has extended the move to 66.51 USD. A technical pullback towards 65.65 USD may occur; a break below this level could extend the correction towards 60.85 USD. Conversely, a rebound from 65.65 USD would favour a continuation of the uptrend toward 66.72 USD.
The Stochastic oscillator aligns with this view, with its signal line above 80 and trending upward, though nearing overbought territory.
Conclusion
Silver’s record rally reflects strong fundamentals – tightening supply, robust industrial demand, and its appeal as a hedge amid economic uncertainty. While the near-term trend remains bullish, the market is approaching overextended levels, increasing the likelihood of a short-term correction. Key support lies around 65.65 USD, with a break below potentially signalling a deeper pullback. Until then, the momentum favours further tests towards 66.72 USD and possibly 69.79 USD.


