
Natural Gas has once again reminded traders of its explosive potential. After finding buyers at a key Fibonacci extension area, prices catapulted 146% in just 12 trading days—an extraordinary rally that left skeptics behind and rewarded those who trusted the technical confluence. This surge wasn’t just about numbers on a chart; it was a vivid demonstration of how market psychology, technical precision, and momentum can align to produce breathtaking moves. For traders and analysts alike, the rally offers a textbook case study in how Fibonacci levels can act as springboards for powerful trends. Charts often speak louder than words, so let’s turn to the charts to see how this remarkable move unfolded…
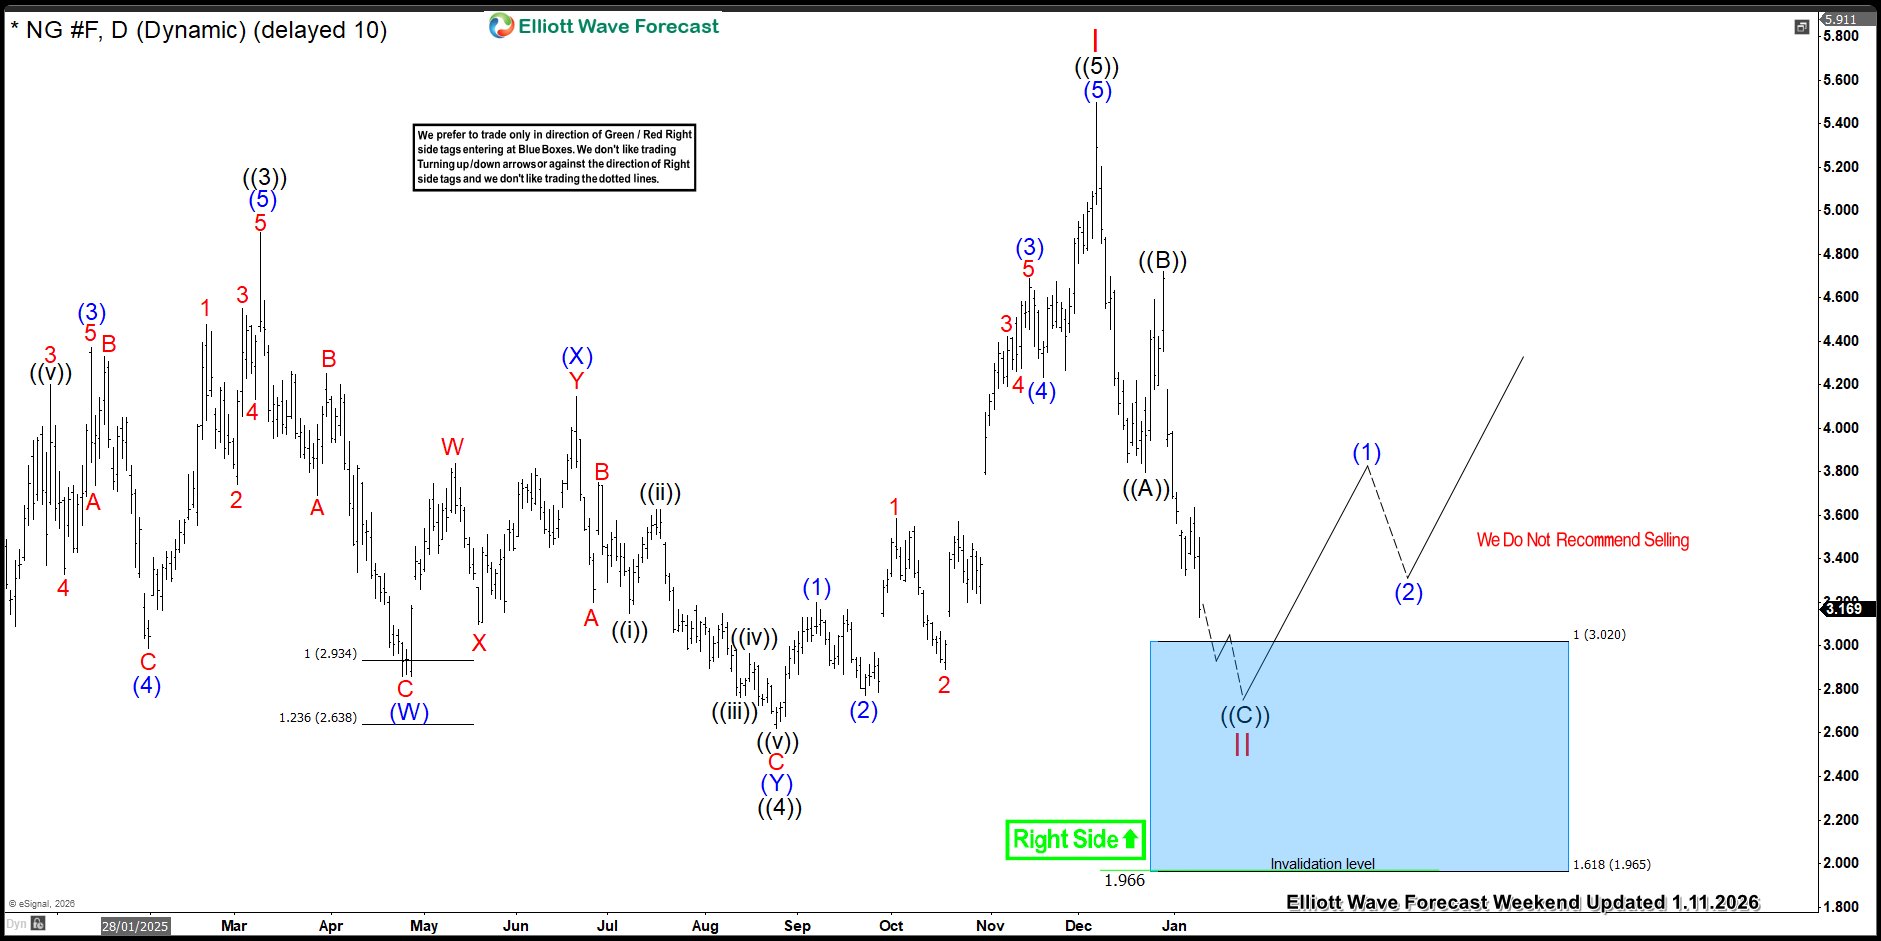
Natural Gas Daily Chart (Jan 14): Price approaches the 3.022 – 1.965 Fibonacci extension zone
Natural Gas 11 Jan Daily Elliott Wave ChartOn the daily chart from January 11, Natural Gas was approaching the 3.022 – 1.965 blue box zone—a critical Fibonacci extension area we had been watching closely. This region carried the potential to attract buyers and set the stage for the next leg of the rally. Going to a smaller time frame, within wave (( C )), we saw wave (3) unfolded shorter than wave (1). This gave us a precise invalidation level for wave (5) of ((C)) at 3.008. A break below that level would have opened the door for a deeper pullback toward the 2.620 – 1.965 area. However, buyers stepped in just before this threshold was tested, defending the structure and reigniting the rally.
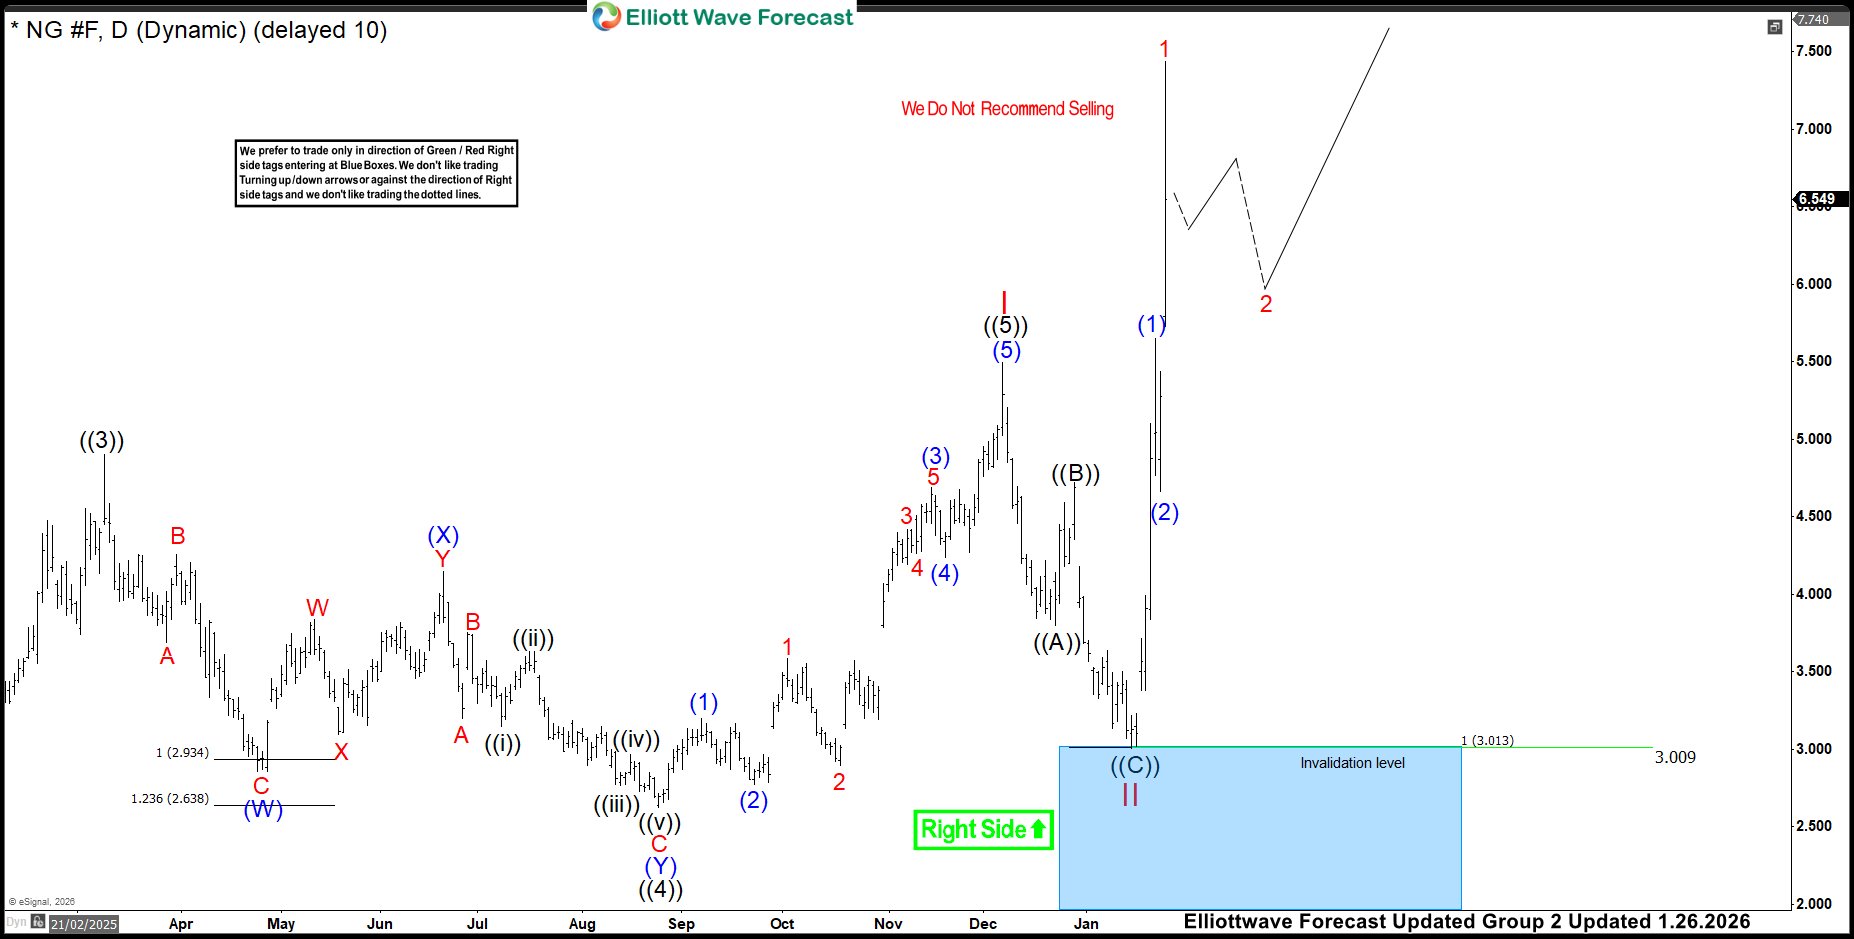
Natural Gas Daily Chart (Jan 26): Fibonacci extension zone drives a powerful 146% rally in 12 days
“Daily chart from January 26 above captures the explosive rally that followed. After price respected the Blue box zone, buyers stepped in with conviction, driving Natural Gas sharply higher reaching a high of $7.439. The move unfolded with textbook momentum, surging 146% in less than two weeks and confirming the strength of the technical setup. The Natural Gas rally underscores a simple truth: Blue box zones mark decisive turning points. Recognizing these areas early can sharpen your edge, helping you anticipate momentum shifts and position yourselves in the market with confidence.


