
- Oil rallies to $65 from the latest new: Iran-US talks cancelled.
- WTI lost some ground after talks were announced but tensions are coming back.
- Exploring an in-depth Technical Analysis of the commodity.
WTI Oil is facing renewed volatility following the latest geopolitical developments:
US–Iran talks scheduled for Friday in Turkey have been cancelled.
Disagreements had emerged between Iranian and US demands. Washington continued to insist on Iran abandoning its ballistic missile program, while Tehran only signaled openness on the nuclear issue.
Markets had initially rallied on the prospect of talks, while oil shed much of its geopolitical premium after the weekend break, gapping lower from $66.00 to $61.50.
But in the current environment, it was unlikely to remain that simple for long.
Iranian officials have reiterated that they remain open to discussions, yet the US now appears to be weighing its options, including preparations for potential intervention.
The core debate centers on whether an intervention could realistically lead to regime change and how escalation might be avoided to prevent a prolonged conflict.
Since the cancellation headline, WTI has jumped back toward $65 and is holding near its relative highs as traders brace for a possible worsening of the conflict.
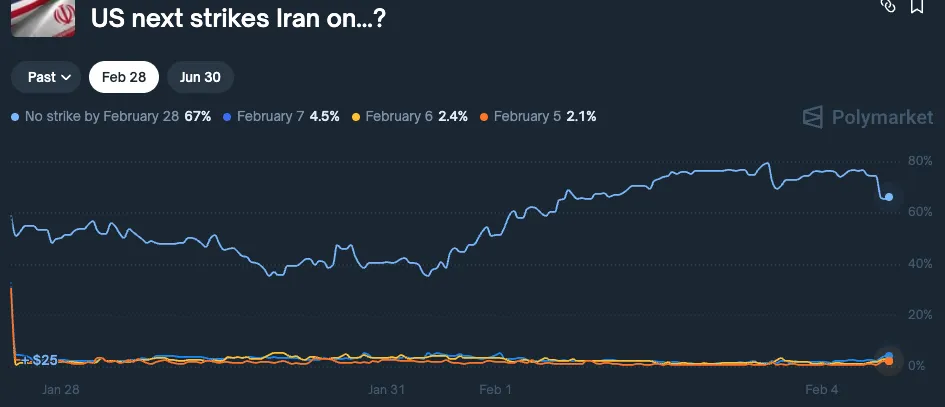
Odds for a US strike in Iran – Source: Polymarket. February 4, 2026
Polymarket-based odds for a strike before February 28 are just below 30%.
Let’s dive into a bottom-up multi-timeframe analysis of WTI (US) Oil to determine whether technicals point to continued upside or if we are reaching a maximum.
We will commence with intraday charts to explore the latest action and see how it develops to Daily charts.
US Oil Bottom-Up Multi-Timeframe Analysis
1H Chart
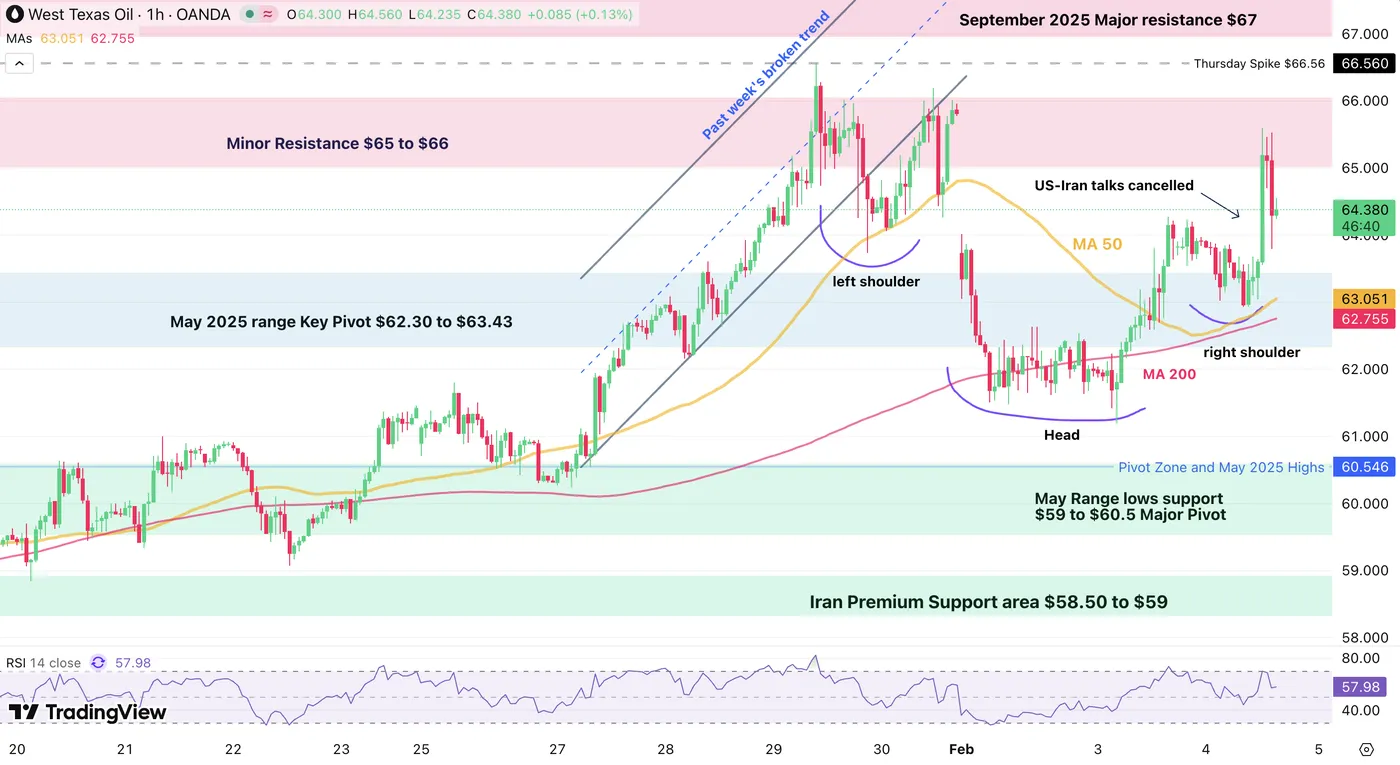
WTI Oil 1H Chart – February 4, 2026. Source: TradingView
Oil just bounced higher by 3% on the headlines but got rejected right in the middle of its $65 to $66 Key resistance.
Despite the rejection, bears aren’t for now able to bring back the commodity to the pre-headline levels so the current pullback just looks like profit-taking.
Some warning signs are arising however with the formation of an inverted Head & Shoulders pattern which could hint to $70 in WTI (see more on the 4H chart just below)
As long as the tensions don’t aggravate, expect a $63 to $66 range.
Any close above $66 will be accompanied with some war headlines (particularly if the past week’s $66.56 highs break).
WTI 4H Chart and Technical Levels
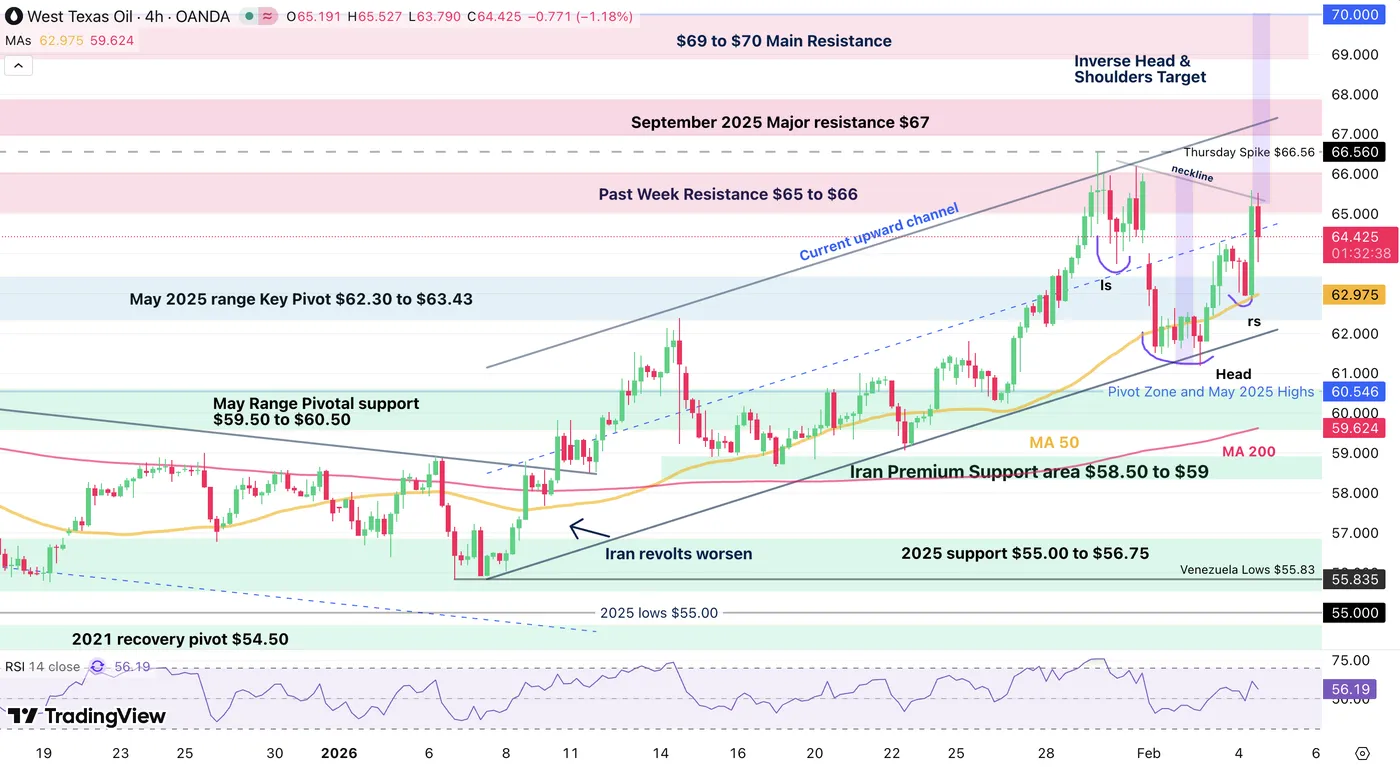
WTI Oil 4H Chart – February 4, 2026. Source: TradingView
It is difficult to discern momentum in Oil when up and down spikes are so common.
Two things are clear from that timeframe:
- WTI bulls are following closely the 4H 50-period MA to push prices higher
- The action is holding within an upward channel, but any news could lead to an upside breakout
The measured move target from the inverted Head & shoulders is shown in purple.
WTI Technical Levels
Levels to place on your WTI charts:
Resistance Levels
- Past week Spike $66.56
- Minor Resistance $65 to $66 (daily highs $65.55)
- September 2025 Major resistance $67 (could get breached if US attacks)
- Psychological Resistance $70 and Inverted H&S target
- $78.43 12-Day War highs
Support Levels
- $64.00 Key psychological support
- $63.00 4H-50 MA
- May 2025 range Key Pivot $62.30 to $63.43
- May Range lows support $59 to $60.5 Major support
- Iran Premium Support area $58.50 to $59
WTI Daily Chart
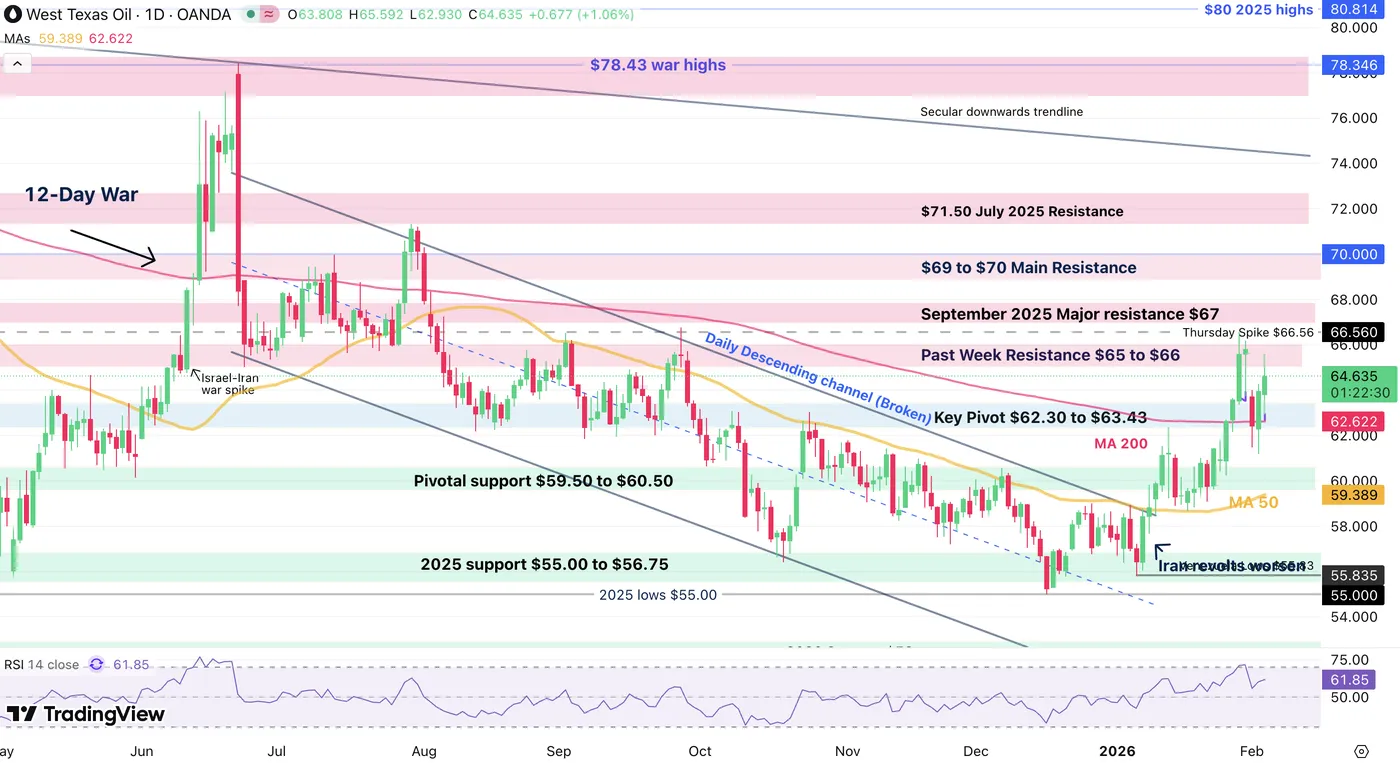
WTI Oil Daily Chart – February 4, 2026. Source: TradingView
Now trading well above its 200-Day Moving Average, Oil is turning increasingly bullish.
Fundamental factors over greener energy are still weighing on the long-run trajectory for the commodity, but geopolitical factors say otherwise.
Trader are pushing the commodity towards the 50% retracement of the 12-Day War from June 2025.
Any close above $66.60 would look at high-paced continuation. This would of course be contingent on tensions remaining elevated.


