
- The US Dollar bounced higher after Warsh’s nomination but is showing signs of stalling.
- Recent labor data previews (JOLTS, Claims) showed unexpected weakness.
- Dollar Index Technical Analysis ahead of Non-Farm Payrolls.
Markets have a lot to digest in recent trading, with geopolitics, the new Fed Chair nomination, earnings season, tech selloffs, and growing fears that AI-driven productivity gains could translate into fewer jobs.
This dynamic sat at the core of yesterday’s volatility. Equity indices moved in a one-way slide, cryptocurrencies crumbled, and even metals stumbled as a global deleveraging of Debasement Trades unfolded.
Two underdogs decided to make their comebacks: the US dollar and US Treasuries, both of which had recently been sidelined as capital chased the shine of precious metals.
Since the Trump-Dollar episode — when comments praising a “great” value of the dollar amid the post-Greenland mini-crisis helped push the greenback to four-year lows — the dollar has staged a strong rebound against most FX peers.
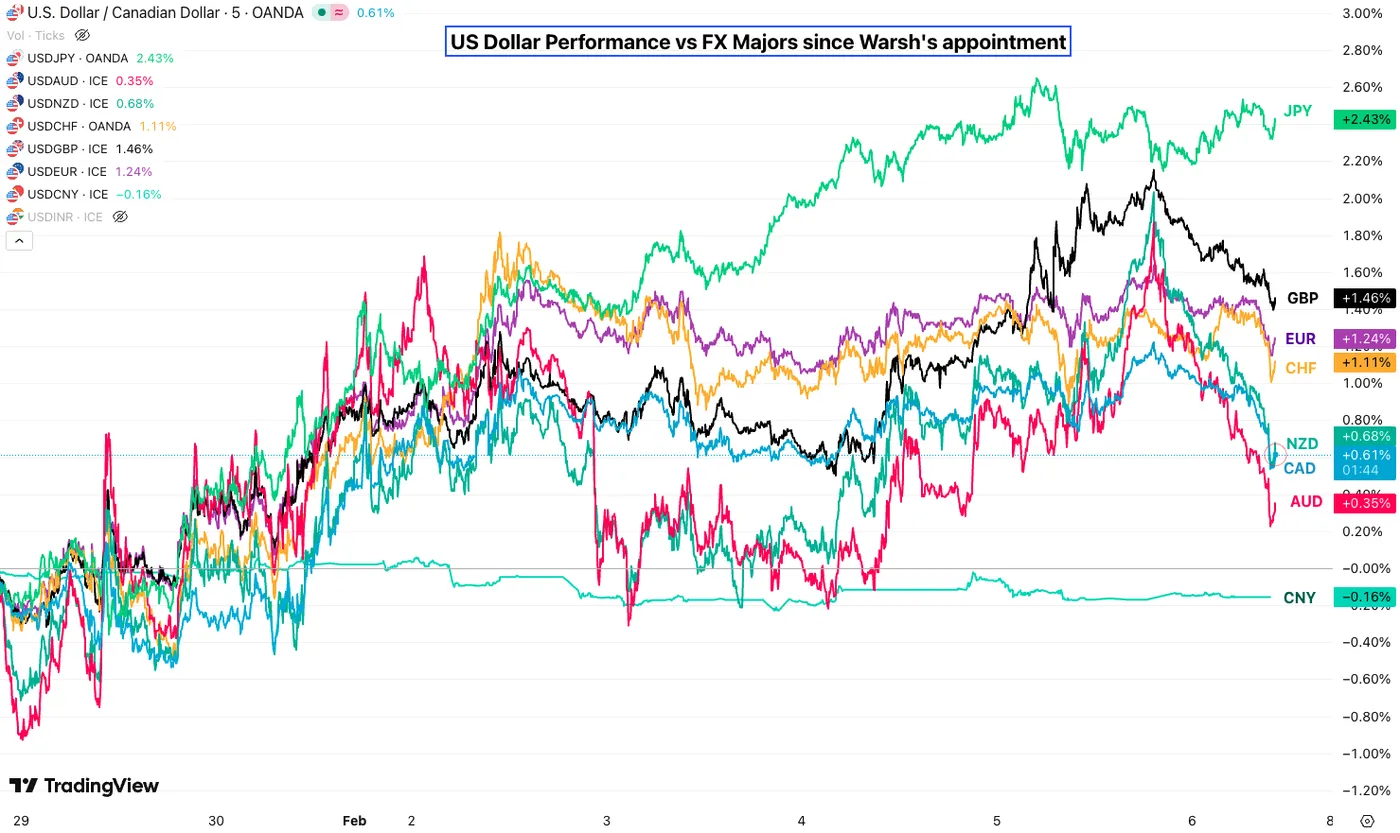
US Dollar Performance against other FX Majors since Warsh’s appointment – Source: TradingView
But yesterday’s rally may now be facing a test.
After labor data improved following October’s scare, markets grew more comfortable with the idea that US employment conditions were stabilizing, if not rebounding, as jobless claims trended lower through December and January.
This week, however, brought fresh warning signs.
Initial claims surprised to the upside, JOLTS pointed to a sharply tighter job-openings market, and the Challenger layoffs report revived uneasy comparisons with 2009.
Risk-off flows and broad deleveraging fueled a bid in the dollar, but traders are now bracing for a softer Non-Farm Payrolls report.
A few basis points of rate cuts have already been repriced, with clarity expected on Wednesday when the delayed NFP is finally released.
All of this could point to a daily top in the Dollar Index.
We’ll dive into an in-depth technical analysis of DXY to assess whether — absent any fresh geopolitical shock, with US-Iran talks still ongoing — the dollar is set to keep falling, or if Kevin Warsh’s nomination has genuinely altered the broader trend.
Dollar Index (DXY) Multi-Timeframe Analysis
Daily Chart
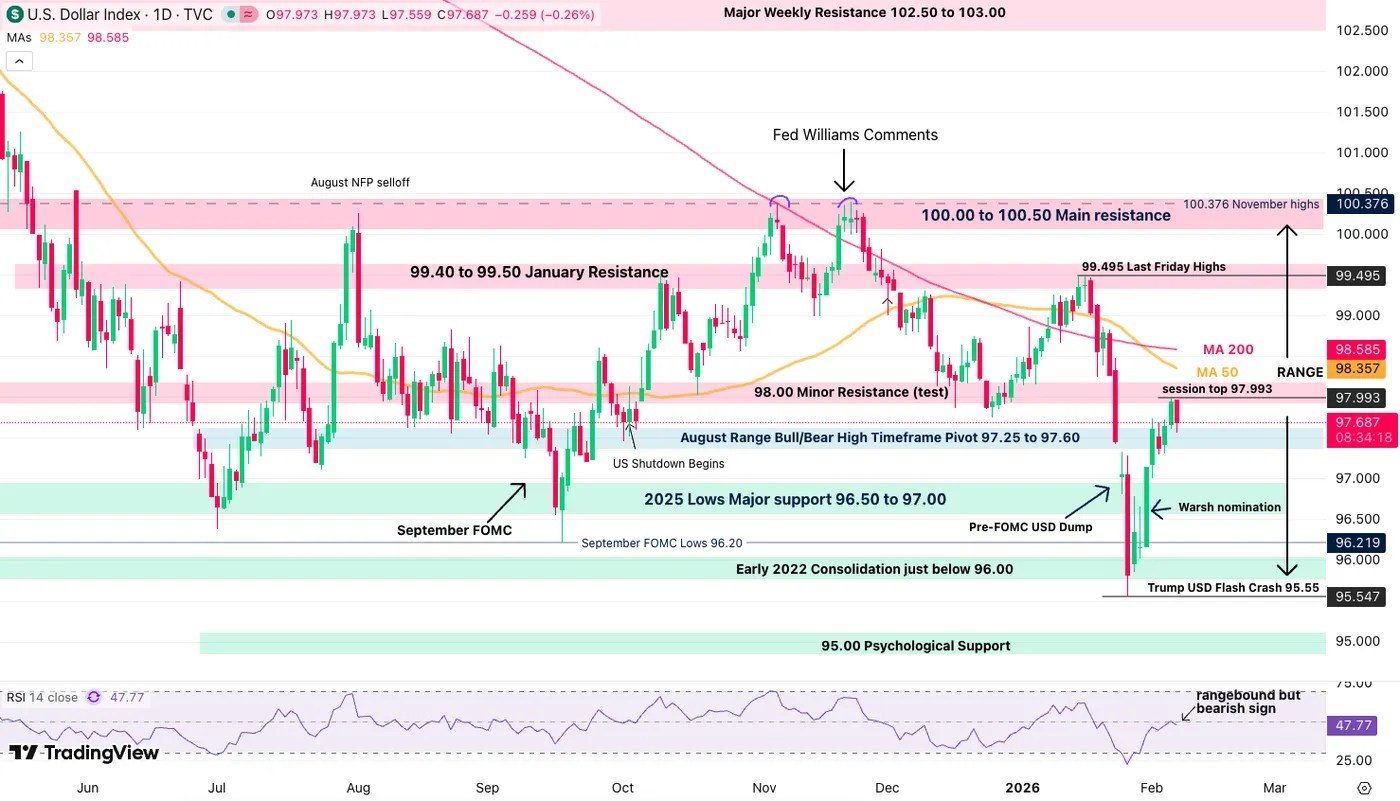
Dollar Index (DXY) Daily Chart. February 6, 2026 – Source: TradingView
The Dollar really embarked into quite a reversal after the FOMC (as was highlighted in our previous analysis) but is now facing the test of the key 98.00 Level.
Despite all the talks of dedollarization and such, the USD has maintained a volatile but rangebound picture since July 2025 between 96.00 and 100.00.
Some new lows were attained against some major pairs like AUD/USD or even EUR/USD, but the dollar selloff has been much more local and contained since.
Despite the larger directionless trend, in-range analysis helps to guide decision making and relative strength to know.
When prices stall at the middle of a range, it implies that the trend could be shifting.
As seen with the Daily RSI taking a turn at the neutral line, and bulls not able to breach the 98.00 Mid-range level, weakness could be expected ahead.
Let’s take a closer look.
4H Chart and Technical Levels
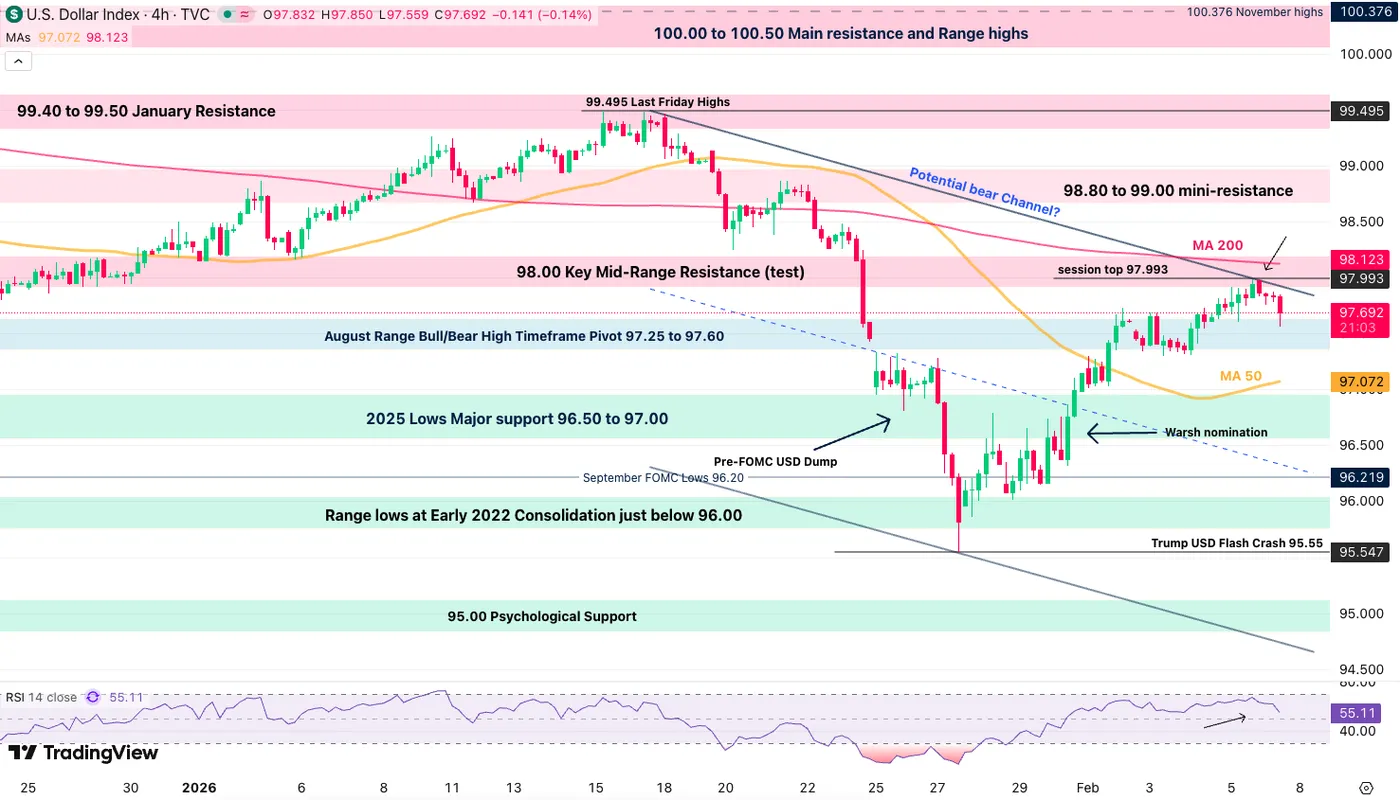
Dollar Index (DXY) 4H Chart. February 6, 2026 – Source: TradingView
Looking closer, we spot how resilient the 98.00 resistance will prove for the current rebound, particularly as early indications of a bear channel formation are showing up.
(Keep in mind that a swift sweep to the upside on any Iran turmoil could change the picture and would need further analysis).
An intermediate range could also be shaping up between 97.00 to 98.00, levels which acted as magnets throughout the past 6-months – Reactions to the 4H 50-period moving average (97.017) will be very important.
- On the session, USD shorts against FX majors could make sense until the 97.00 handle. Pre-weekend risk could warrant position closure.
Levels to place on your DXY charts:
Resistance Levels
- 98.00 Key Mid-Range Resistance (test, mini-range highs)
- Session Highs 97.993
- Mini-resistance 98.80 to 99.00
- 99.40 to 99.50 January Resistance
- 100.376 November highs
Support Levels
- August and mini-range Pivot 97.25 to 97.60
- 2025 Lows Major support 96.50 to 97.00 (mini-range lows, 4H 50-MA)
- Early 2022 Consolidation just below 96.00
- Trump USD Flash Crash 95.55
- 95.00 Main psychologic support
1H Chart
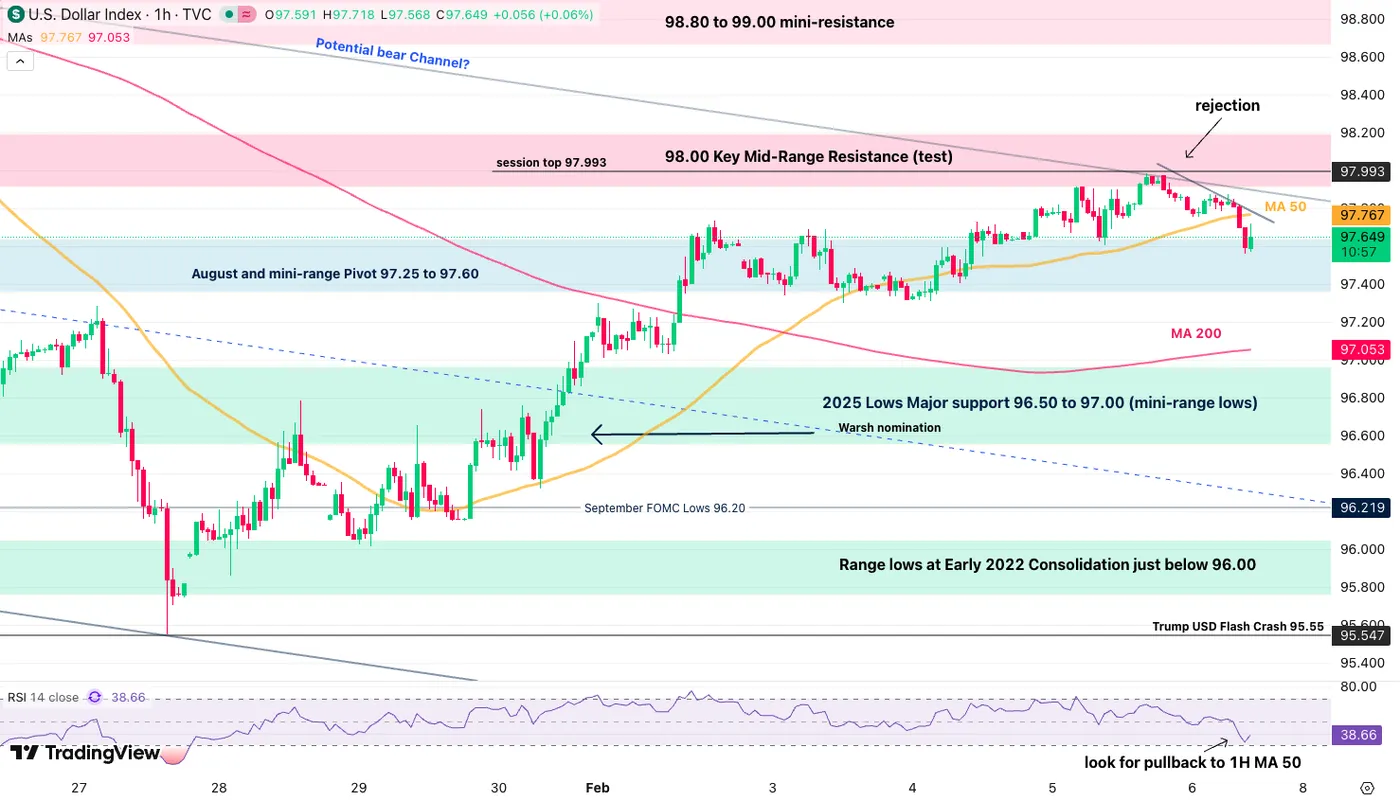
Dollar Index (DXY) 1H Chart. February 6, 2026 – Source: TradingView
Looking at reactions, the US Dollar is getting rejected from reaching the resistance zone. However, oversold RSI conditions could point to an imminent retest of its 1H 50-period MA (97.76) before potentially correcting.
If prices get there, the 97.00 level will be very essential for the times to come:
- Rebounding there would take out the potential bear channel (seen on the 4H timeframe)
- Breaking the level hints at a retest of the Trump-USD Lows (95.55)
- Any sudden flash above 98.00 (candle close above and high volume) hints at geopolitical tensions worsening.
Safe Trades!


 but is now facing the test of the key 98.00 Level.)