
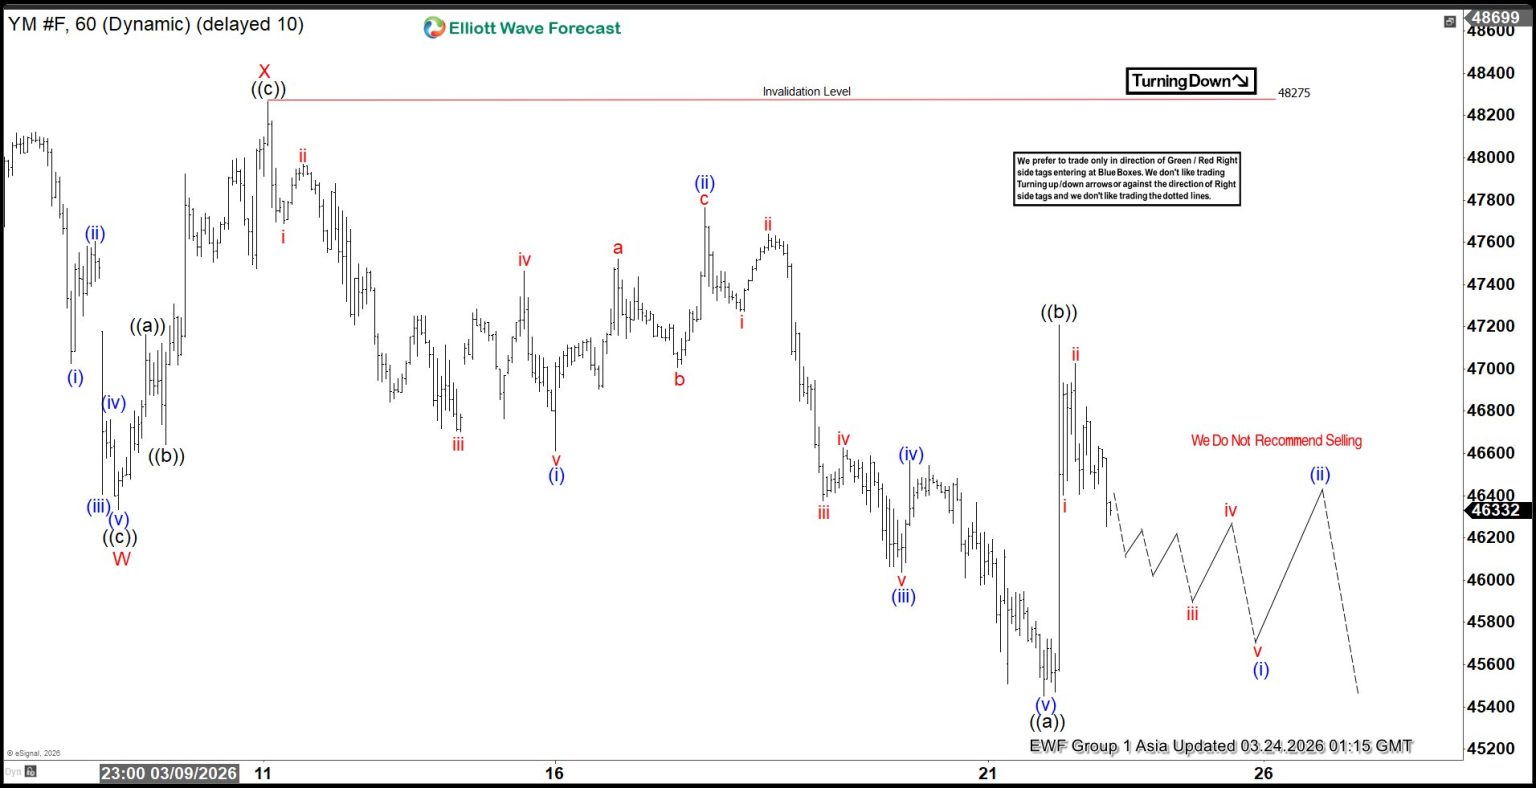
Dow Futures (YM) is correcting the larger degree cycle that began from the April 2025 low. The current decline is unfolding as a double three Elliott Wave structure, which highlights a complex corrective phase rather than a simple retracement. From the all-time high on February 10, 2026 at 50,611, wave W finished at 46,333, while the subsequent rally in wave X reached 48,275, as shown in the one-hour chart. The ongoing wave Y is progressing with internal subdivision that takes the form of a zigzag, consistent with the broader corrective framework.
From the peak of wave X, wave ((a)) dropped to 45,453, followed by wave ((b)) which appears complete at 47,210. In the near term, as long as rallies remain capped below 47,210 and more importantly below 48,275, the expectation is for the Index to continue extending lower. This outlook aligns with Fibonacci extension measurements taken from the February 10, 2026 high. The projected downside target falls within the 100% to 161.8% extension range, corresponding to 41,268 – 43,925. This zone is significant because it represents an area where buyers may emerge, potentially supporting renewed upside momentum once the corrective sequence has matured. The structure therefore suggests that while short-term weakness dominates, the broader cycle retains the potential for recovery once the corrective objectives are satisfied
Dow Futures (YM) 60-Minute Elliott Wave Chart
YM Elliott Wave Video:
You are currently viewing a placeholder content from Default. To access the actual content, click the button below. Please note that doing so will share data with third-party providers.


 is correcting the larger degree cycle that began from the April 2025 low. The current decline is unfolding as a double three Elliott Wave structure, which highlights a complex corrective phase rather than a simple retracement. From the all-time high on February 10, 2026 at 50,611, wave W finished at 46,333, while the subsequent rally in wave X reached 48,275, as shown in the one-hour chart. The ongoing wave Y is progressing with internal subdivision that takes the form of a zigzag, consistent with the broader corrective framework.)