
- Oil tumbled in the previous session as negotiations could be back on the table.
- Nevertheless, realities of war indicate that the conflict isn’t looking to ease like this, which could prevent positive sentiment.
- Exploring an in-depth Technical Analysis of the commodity
In War, there are words and realities, propaganda and clearly defined facts – and the frontier between both is rarely so transparent.
President Trump changed the Market trajectory after saying US-Iran negotiations could resume, a report initially denied by Iran but later confirmed as Iranian Parliament Speaker Qalibaf travelled to Pakistan, where talks would reportedly occur.
The fact that his diplomatic flight took place with US and Israeli approval proves that the US President wasn’t just blowing steam – particularly given Al Arabiya reports that Mojtaba Khamenei, the newly appointed Ayatollah, would also be open to talks.
Nevertheless, the cloud remains over how deep and effective these talks would be regarding an official dropping of Iranian Ballistic Missiles and nuclear program, and, more importantly for immediate markets, the reopening of the Strait of Hormuz.
A ceasefire deal is currently priced at around 44% for the end of April – to me, people are a bit pessimistic about the potential for the War to end sooner rather than later.
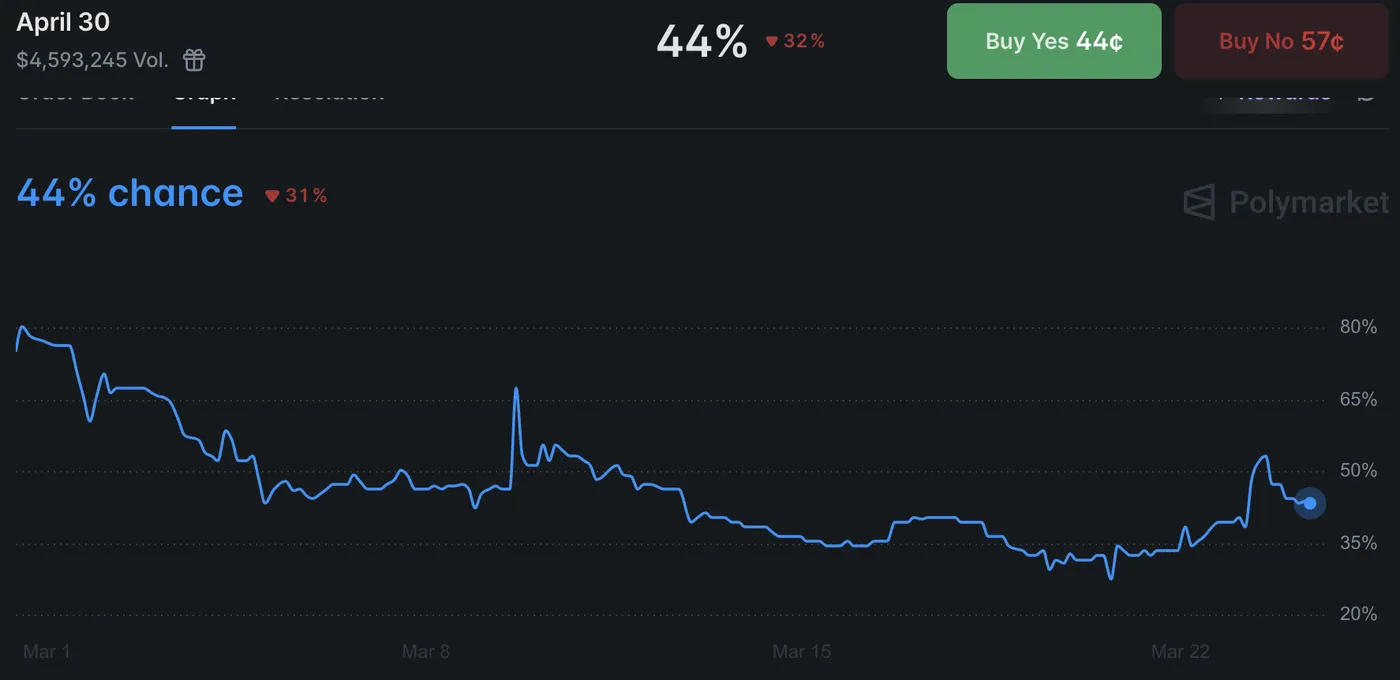
US-Iran Ceasefire – Source: Polymarket. March 24, 2026
The reality, however, gets a bit different, with Gas infrastructure attacks, Saudi Arabia leaning to join the war and changing its stance, and the fleet of 4,500 Marines arriving in the Middle East towards the end of the week.
The latter is the most concerning fact for Markets, leading to swift comparisons to Afghanistan and Iraq, which also hints at a much longer war.
It will depend, of course, on how negotiations result:
Will it result in free passage in the Strait of Hormuz? Will the Iranian population gain more power and freedom after the 5-week initial Wartime Period? Will attacks on both sides actually cease and lead to longer-term peace?
All of these questions will have to find clear answers in order for Markets to get rid of the uncertainty cloud looming over investors since the beginning of March.
As the situation should become clearer as this week continues, let’s dive into a multi-timeframe analysis of WTI (US) Oil to spot where potential action could take place and where to look if they fail.
US Oil Multi-Timeframe Analysis
WTI Daily Chart
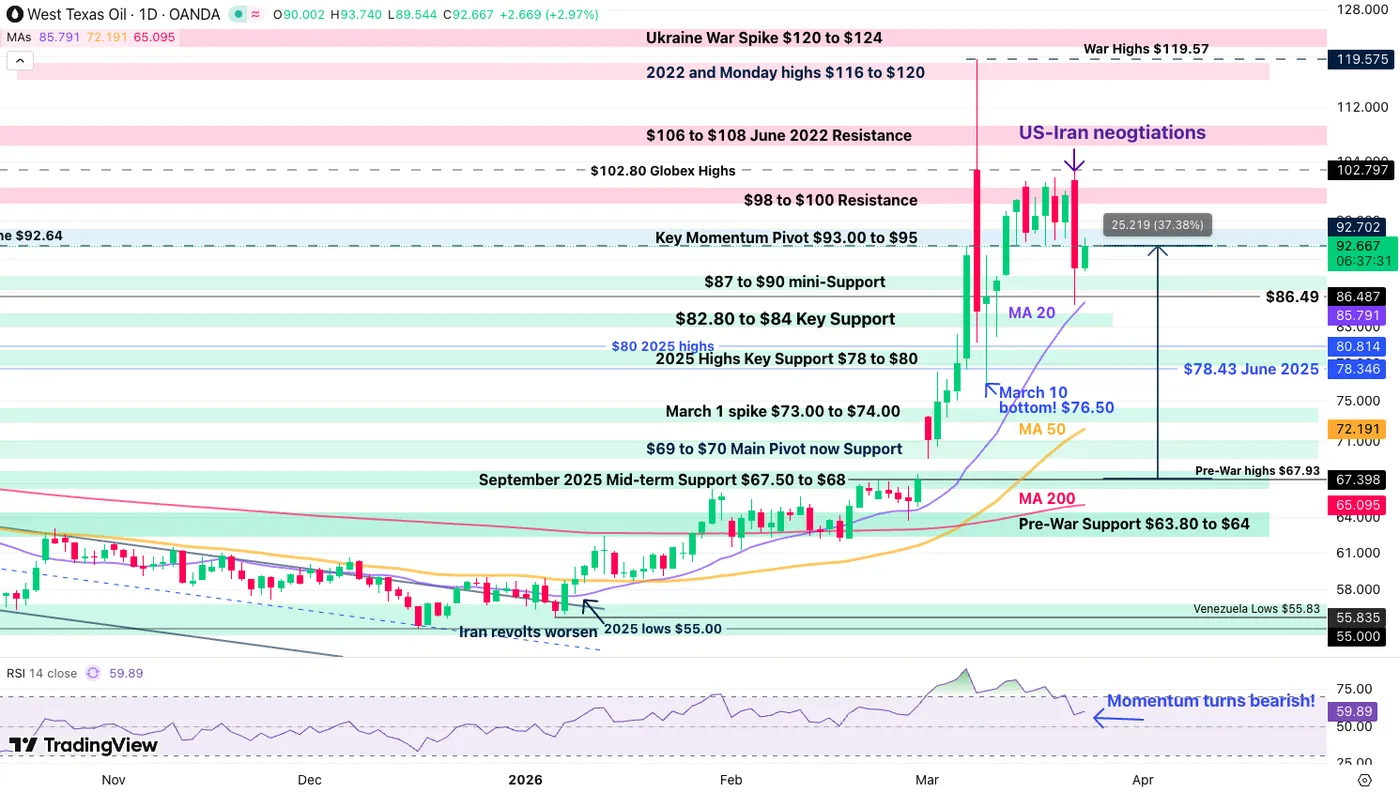
WTI Oil Daily Chart – March 24, 2026. Source: TradingView
With the intense volatility seen in the commodity since the beginning of the conflict, the daily chart can seen quite unclear.
But traders need to look at what is standing out:
Yesterday’s drop tested the 20-Day Moving Average ($86.00) which remains the indicator dictating momentum – breaching it to the downside would imply further easing in conditions. Above, the action remains relatively bullish.
Also, yesterday’s move lower actually brought the action back right around the War Spike, implying that the action is at least much more balanced than it was in the past week.
As the morning session continues, Bulls are attempting a rebound, hence, the levels to watch for momentum clearly remains the $93.00 to $95 zone (bullish above, neutral/bearish below).
WTI 4H Chart and Technical Levels
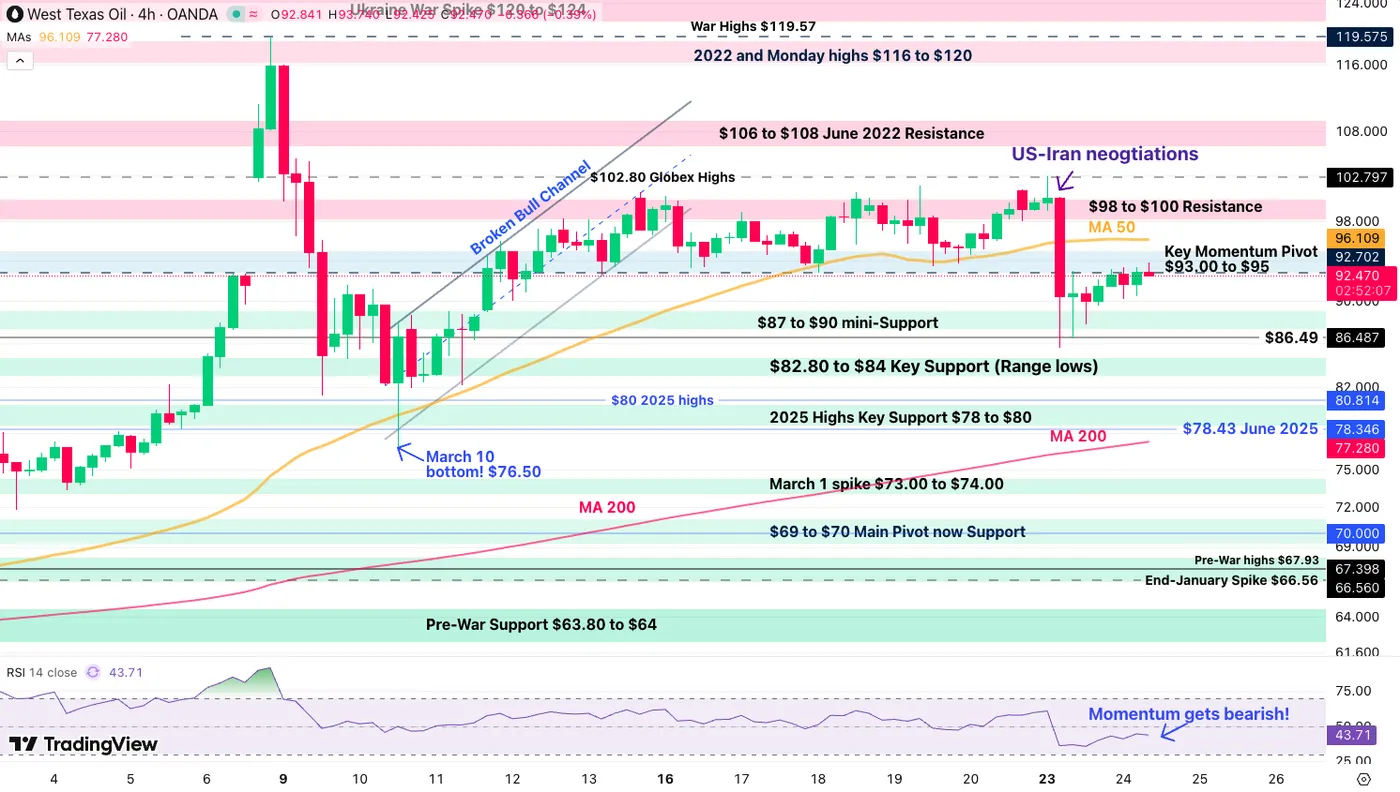
WTI Oil 4H Chart – March 24, 2026. Source: TradingView
The 4H RSI is at least not pointing to a further rally from where things stand:
Forming a top-looking shape, bull exhaustion at the Key Pivot area could forge at least a new range below $93.
WTI Technical Levels:
Resistance Levels
- $92.70 Intraday Resistance
- Key Momentum Pivot $93.00 to $95 (immediate resistance, bear below)
- $96.11 4H 50-period MA
- $98 to $100 Resistance
- $106 to $108 June 2022 Resistance
- 2022 and Monday highs $116 to $120
Support Levels
- $87 to $90 mini-Support
- Past session lows $86.49
- $82.80 to $84 Key Support
- 2025 Highs Key Support $78 to $80
- Past week spike $73.00 to $74.00
- $69 to $70 Main Support (If Ceasefire, should quickly head towards there)
- 2025 lows $55.00
1H Chart and Action levels
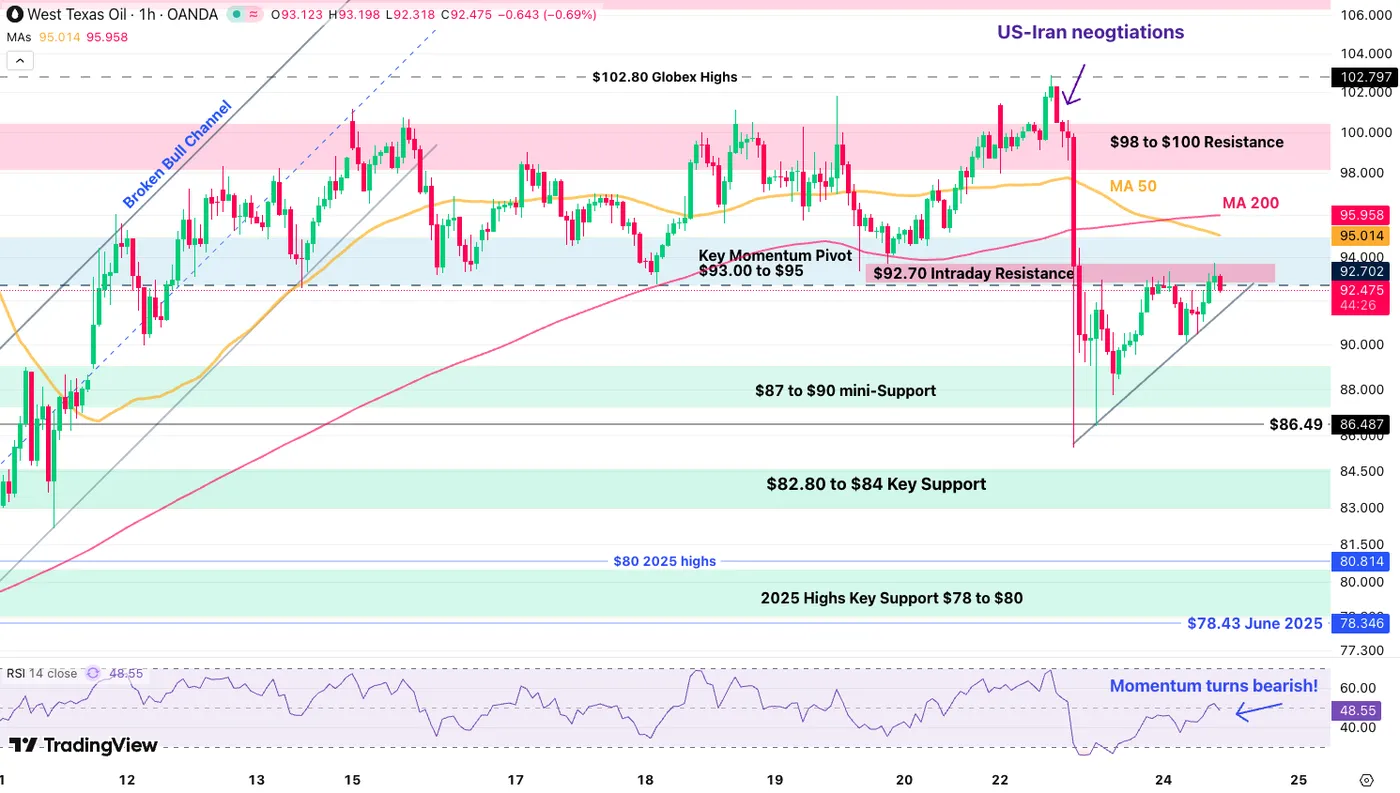
WTI Oil 1H Chart – March 24, 2026. Source: TradingView
The 1H timeframe really shows how yesterday tilted the scales towards towards a more balanced price action – even slightly bearish.
Yesterday’s announcement brought a wave of optimism which quickly found its lows; WTI has been rallying slowly since and forming a rising wedge formation (bearish).
The 1H RSI is also turning lower from neutral, a sign of potential reversal.
But all things considered, as long as bears can’t reject the $92.70 intraday resistance, the action is more mixed than anything – breaking the intraday highs would give the upper hand to the bulls towards $95.
Keep track of the headlines and the Wedge support.
Safe Trades!


