
- Bitcoin (BTC/USD) has started the new quarter with renewed optimism, snapping a five-month losing streak.
- Institutional demand is returning, as Bitcoin spot ETFs recorded over $117 million in inflows on Tuesday, concluding March with $1.32 billion in total inflows and effectively ending a four-month streak of net withdrawals.
- The technical outlook is cautiously optimistic with a sustained daily close above $72,600 being the key confirmation for a fast move toward the $80,000.
Bitcoin (BTC/USD) has kickstarted the new quarter with a renewed sense of optimism, snapping a grueling five-month losing streak, its longest since 2018. After a bearish start to the week, the premier cryptocurrency has caught a bid in early Wednesday trade, reclaiming the $68,500 handle and teasing a breakout toward psychological resistance at $70,000.
The shift in sentiment is palpable as a combination of institutional re-engagement and a sudden de-escalation in Middle East tensions provides the “risk-on” spark that bulls have been waiting for.
Source: TradingView
Early Trade: Macro Tailwinds and the “Trump Reversal”
The early move today saw Bitcoin briefly touch $69,300, buoyed by headlines suggesting a diplomatic path forward in the US-Iran conflict.
President Trump’s recent signals regarding a limited four-to-six-week military timeline, coupled with conciliatory remarks from Iranian President Masoud Pezeshkian, have allowed markets to price out some of the “war premium” that has weighed on risk assets.
From a fundamental perspective, the “dry spell” in institutional demand appears to be ending. Bitcoin spot ETFs recorded over $117 million in inflows on Tuesday, the second consecutive day of positive growth.
More importantly, March concluded with total ETF inflows of $1.32 billion, effectively ending a four-month streak of net withdrawals. This may be seen as a suggestion that the “smart money” is beginning to view the sub-$70k levels as an attractive entry point for Q2.
The “Strategy” Factor: Saylor’s Accumulation Engine Restarts
A significant driver for this week’s price action is the resurgence of Michael Saylor’s “Strategy” (MSTR) as a primary buyer. With the company’s STRC preferred stock trading back above its $100 par value, the window for capital raising has reopened.
Estimates suggest Strategy is positioned to acquire over 1,100 BTC (~$76.25 million) this week alone. Historically, Bitcoin has shown a strong correlation with MSTR’s buying cycles, often rallying significantly when the company’s accumulation engine is in full gear.
The Road Ahead: Momentum vs. History
While the “hopium” is high, we must remain objective. Historical data from CoinGlass shows that while April is typically a “green” month (averaging 12.2% returns), Bitcoin has a habit of reversing its March trend. Since March closed slightly in the green, contrarians might argue for a cautious outlook.
However, if history repeats the 2018/2019 cycle where breaking a multi-month losing streak led to a 300% rally, the current consolidation might just be the launchpad for a historic Q2.
Technical Analysis: A Squeeze Toward $80,000?
Looking at the charts, Bitcoin’s recent bounce from the $60,000 floor, which many now view as a local bottom is technically significant. The pair has successfully retested the lower boundary of a prevailing bear flag pattern and held.
Despite the retreat below $70,000, the technical outlook remains cautiously optimistic rather than bearish. The trendline break on the H4 chart below also reinforces this idea of a move to the upside.
I will be watching the $71,000 level closely; a break here confirms that the bulls are back in the driver’s seat with $80,000 firmly in their crosshairs.
Key Levels to Watch:
- Resistance: The immediate hurdle sits in the $69,300 – $71,000 zone. This area is congested with the 50-day EMA and a massive supply zone where roughly 650,000 BTC were previously acquired. A sustained daily close above $72,600 would be the “smoking gun” for bulls, likely triggering a fast move toward $80,000.
- Support: On the downside, the $65,900 level remains pivotal. Should we lose this, the 200-week SMA near $59,400 would be the final line of defense before a deeper correction toward the $50,000 psychological mark.
Bitcoin (BTC/USD) Four-Hour Chart, April 1, 2026
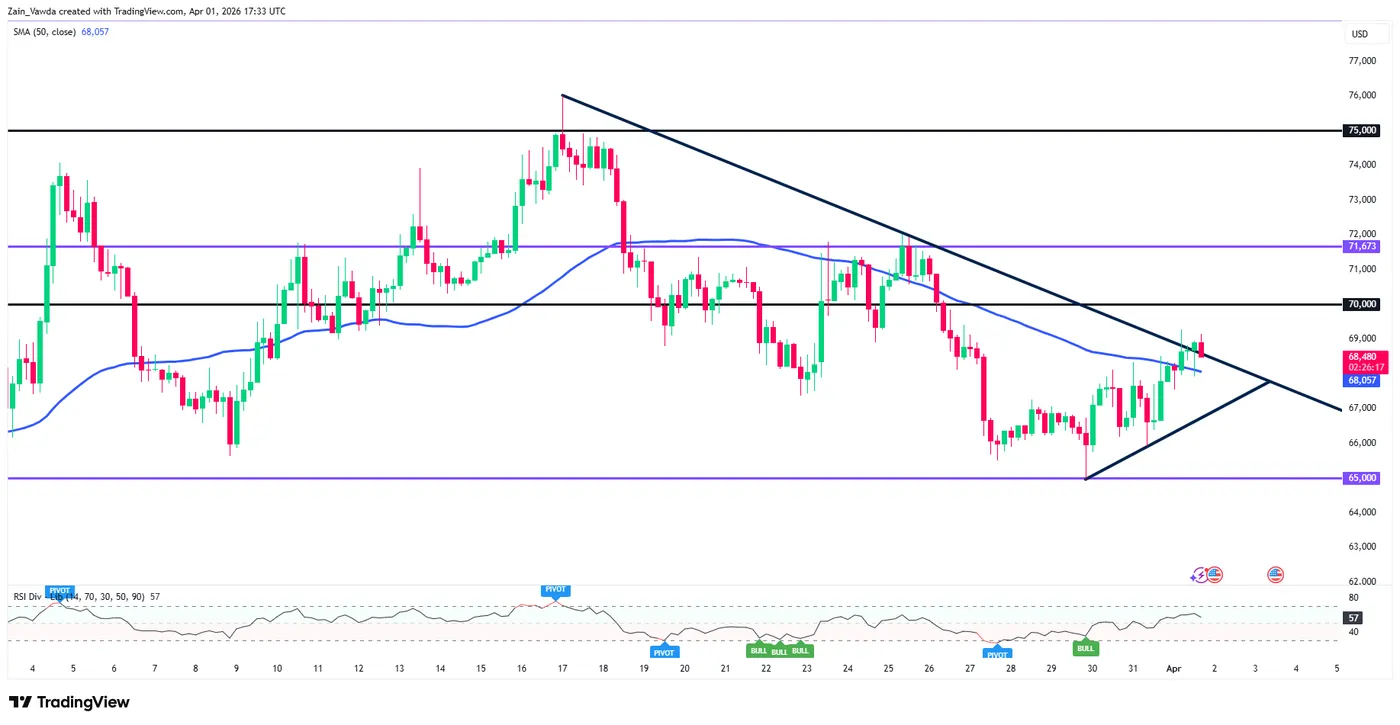
Source: TradingView.com (click to enlarge)


 has started the new quarter with renewed optimism, snapping a five-month losing streak.)