
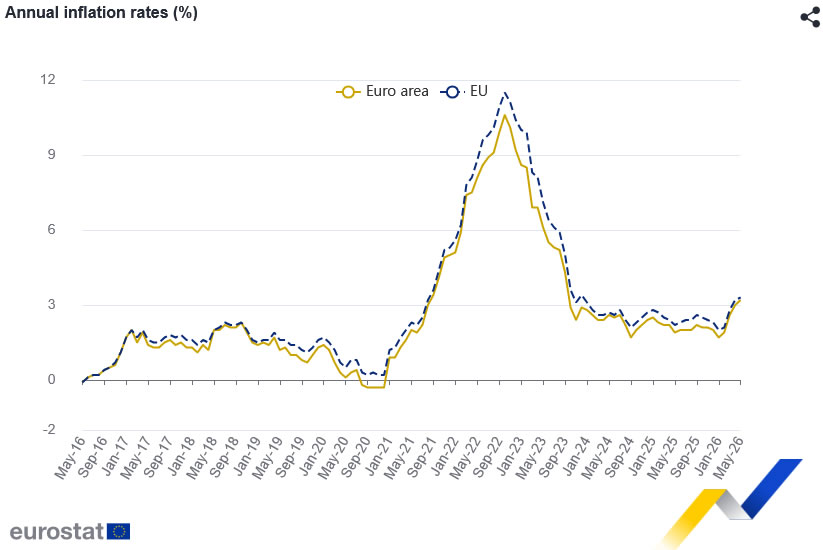
Eurozone inflation was finalized at 3.2% yoy in May, up from 3.0% yoy in April, while core inflation accelerated more sharply from 2.2% yoy to 2.6% yoy. The data confirm that underlying price pressures strengthened across the bloc during the month, reinforcing concerns that inflation is becoming more broad-based despite easing geopolitical tensions and falling oil prices in recent weeks.
Services was the largest contributor to inflation, adding 1.61 percentage points to the headline rate. Energy contributed a further 0.98 percentage points, while food, alcohol and tobacco added 0.36 percentage points and non-energy industrial goods contributed 0.23 percentage points. The figures suggest that inflation is no longer solely an energy story, with domestic services prices continuing to exert significant upward pressure on overall consumer prices.
Across the wider European Union, annual inflation was finalized at 3.3% yoy, up from 3.2% yoy in April. However, inflation trends were highly uneven across member states. Sweden recorded the lowest annual rate at 1.1%, followed by Denmark and Czechia at 1.8%. At the other end of the spectrum, Romania posted inflation of 9.7%, while Bulgaria and Lithuania recorded 6.3% and 5.1% respectively. Compared with April, inflation fell in eleven member states but increased in sixteen.
| Indicator | Apr 2026 | May 2026 | Final |
|---|---|---|---|
| Eurozone CPI Y/Y | 3.0% | 3.2% | 3.2% |
| Eurozone Core CPI Y/Y | 2.2% | 2.6% | 2.6% |
| EU CPI Y/Y | 3.2% | 3.3% | 3.3% |
Contributions to Eurozone Inflation
| Component | Contribution to Headline CPI |
|---|---|
| Services | +1.61pp |
| Energy | +0.98pp |
| Food, Alcohol & Tobacco | +0.36pp |
| Non-Energy Industrial Goods | +0.23pp |


