
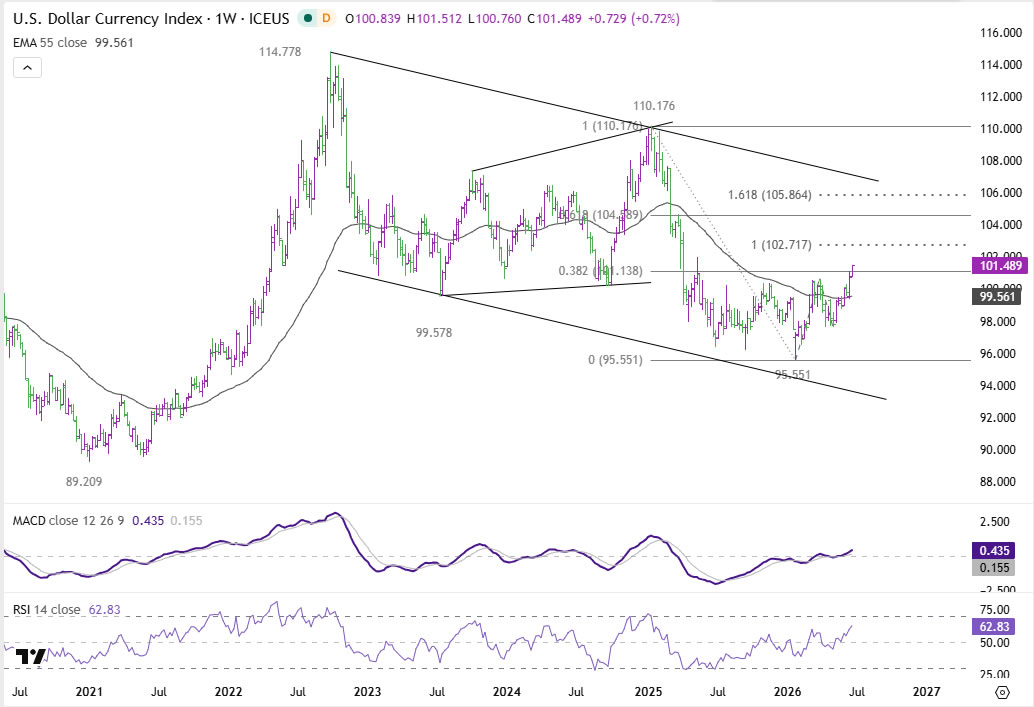
Dollar’s rally gathered further momentum this week as a combination of technology-sector liquidation, quarter-end positioning, and growing expectations of additional Federal Reserve tightening pushed Dollar Index through a critical long-term technical barrier. The move marks one of the most important developments for the currency market in 2026, as the break above the 38.2% retracement of the 110.17 to 95.55 decline at 101.38 suggests the broader downtrend from last year’s high may already have run its course.
The latest leg higher has been driven by more than Fed expectations alone. Risk aversion intensified this week with a sharp selloff in global technology stocks triggered a broad flight into liquidity. While South Korea’s KOSPI managed to rebound briefly today following its near-10% collapse earlier in the week, buying interest faded quickly. Japan’s Nikkei and Taiwan’s equity market also struggled to sustain gains as investors continued reducing exposure to AI-linked semiconductor names. Taiwan Semiconductor Manufacturing Co. became a particular focal point, falling more than -3% and weighing heavily on regional sentiment.
Importantly, the weakness in equities appears driven by market structure rather than deteriorating economic fundamentals. With June 30 approaching, institutional investors have little incentive to add fresh risk. Fund managers who have already secured strong first-half performance numbers are more focused on preserving gains than deploying capital into volatile technology shares. As a result, rebound seen over recent sessions have lacked conviction, with short-covering replacing genuine long-term buying.
That dynamic helps explain why risk sentiment may struggle to stage a meaningful recovery before early July. The calendar itself has become a headwind for equities and a tailwind for Dollar. Until a new quarter begins and fresh capital allocation decisions are made, selling pressure from portfolio rebalancing and window-dressing activity could continue to dominate market behavior. Under these conditions, Dollar demand is likely to remain well supported in the near term.
Attention will then shift quickly to next week’s June non-farm payroll report. Markets are already debating whether the Fed will deliver one additional hike or two before year-end. A stronger-than-expected employment report could further reinforce the view that inflation pressures, particularly in the service sector, will remain persistent enough to justify additional tightening. Such an outcome would provide another powerful catalyst for Dollar strength.
Technically, the break above 38.2% retracement of 110.17 to (2025 high) to 95.55 at 101.38 carries important implications. The move suggests that the entire decline from 110.17 may have completed at 95.55. Further rise is expected as long as 100.31 resistance turned support holds.
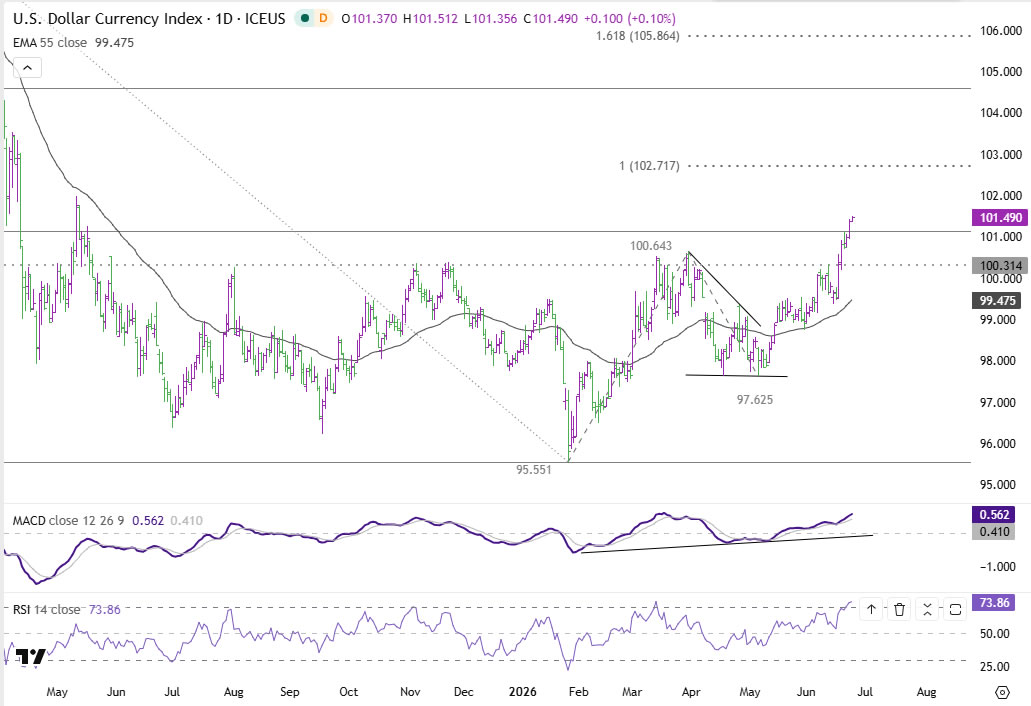
Next target is 100% projection of 95.55 to 100.64 from 97.62 at 102.71. That level may become the defining battleground of early July. Decisive break above 102.71 would strengthen the case that the rally from 95.55 is an impulsive medium-term bull move capable of extending through the second half of the year. Rejection there, however, would leave open the possibility that the entire rally is merely a corrective rebound within a broader bearish structure.
For now, Dollar bulls hold the advantage, but the most important test may still lie ahead.


