


Key Highlights
- USD/JPY started a major decline from 160.40 and fell by over 500 pips.
- A bearish continuation pattern could be forming with resistance at 154.80 on the 4-hour chart.
- WTI Crude Oil prices surged further and even surpassed $100.
- Gold bulls struggled to push prices above the key hurdle at $4,480.
USD/JPY Technical Analysis
The US Dollar failed to remain stable above 160.00 and tumbled against the Japanese Yen. USD/JPY dipped below 158.00 and 156.20 to enter a bearish zone.
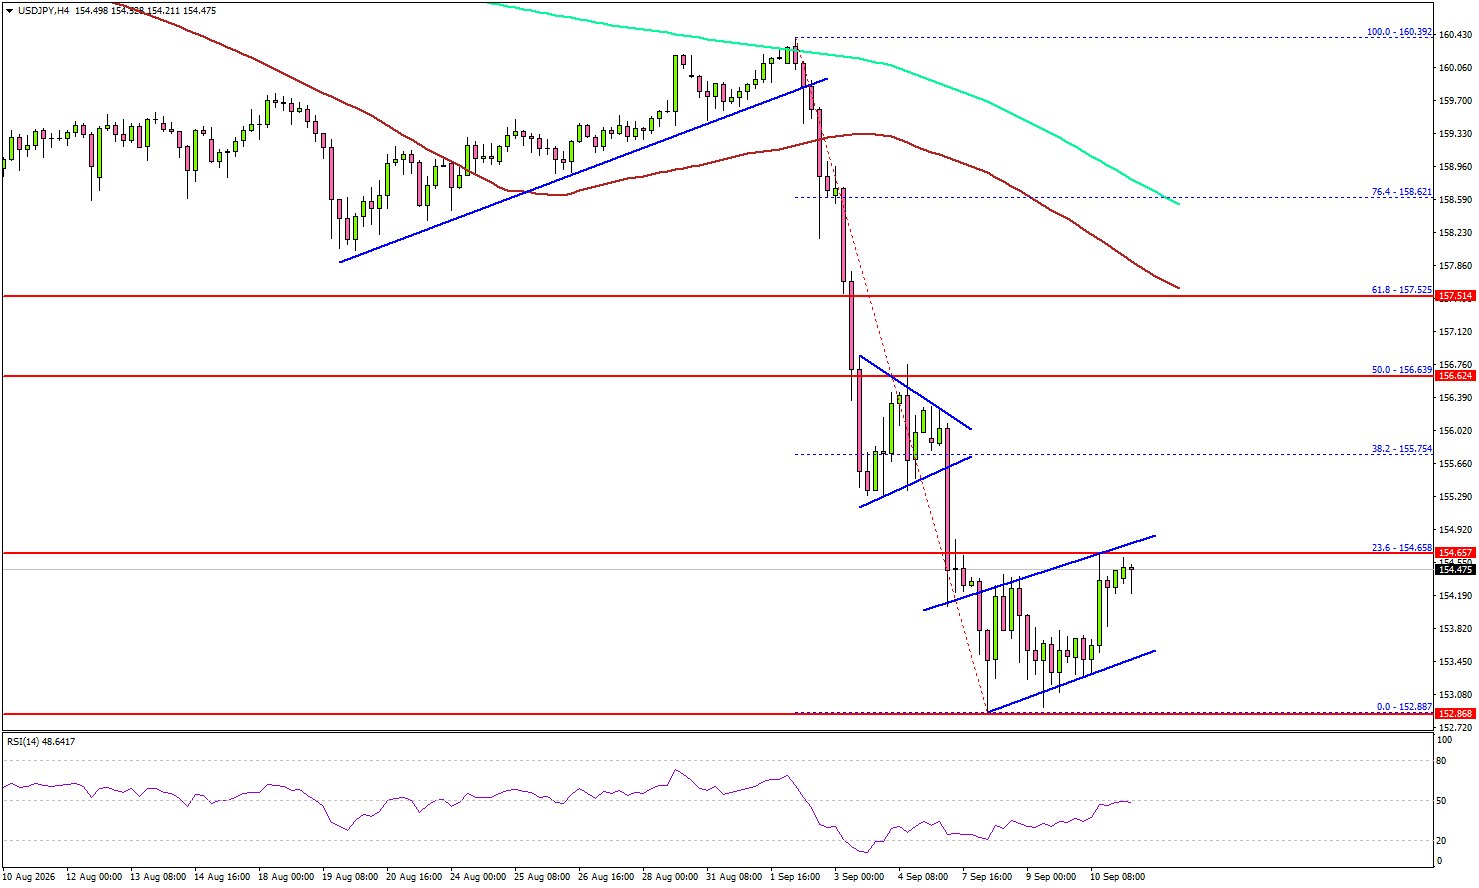
Looking at the 4-hour chart, the pair settled below the 155.00 level, the 100 simple moving average (red, 4-hour), and the 200 simple moving average (green, 4-hour). It tested the 152.85 zone and started a consolidation phase.
On the upside, an immediate resistance could be near the 23.6% Fib retracement level of the downward move from the 160.39 swing high to the 152.88 low at 154.65. There is also a bearish continuation pattern that could be formed with resistance at 154.80.
The next major resistance might be 155.25. A close above 155.25 could start another steady increase. In the stated case, the bulls could aim for a move to 156.60.
If there is another decline, the pair might find bids near 153.40. The first major support could be near 152.85. A downside break and close below 152.85 might start a major leg down. In the stated case, the bears could aim for a move to 150.00.
Looking at WTI Crude Oil prices, the price gained bullish momentum, surpassed $100, and there are no signs of a major pullback yet.
Upcoming Key Economic Events:
- US Consumer Price Index for August 2026 (MoM) – Forecast +0.4%, versus +0.1% previous.
- US Consumer Price Index for August 2026 (YoY) – Forecast +3.4%, versus +3.4% previous.
- US Consumer Price Index Ex Food & Energy for August 2026 (YoY) – Forecast +2.4%, versus +2.5% previous.
- Michigan Consumer Sentiment Index for Sep 2026 (Prelim) – Forecast 51.0, versus 51.7 previous.





