


TL;DR: Gold plunged 3.61% on Friday to 3,875.19, its first decisive daily close below $4,000, as Fed-led global tightening and liquidation-style selling converged. Monday’s bounce toward 3,907 looks like relief within an established downtrend, with resistance at 4,083.41 and the next downside objective at 3,748.81.
Why Is Gold Struggling Even as Treasury Yields Fall?
Gold is attempting to recover after another punishing selloff, but the forces pushing the metal lower have become more complicated than a conventional story about interest rates and Dollar strength. Major central banks are still confronting inflation with tighter monetary policy, while the latest technology-led equity correction may be forcing investors to reduce exposure across otherwise unrelated markets. The combination is particularly uncomfortable for Gold: monetary tightening undermines its investment appeal, while financial-market stress may be turning an asset traditionally associated with protection into something investors sell when they need liquidity.
Friday delivered the latest warning. Gold plunged 3.61% to close at 3,875.19, marking its first decisive daily close below the psychologically important $4,000 level after an earlier brief breach in late October. Silver fell even harder, losing 5.82% and finishing below $50. By Monday, Gold had recovered toward 3,907 and Silver had climbed back above $50, offering some relief after the sharpest selling.
But the recovery needs to be viewed against the scale of the preceding decline. Gold is now approximately 30% below its January peak of 5,598.75, while its daily and weekly charts continue to show a sequence of lower highs and lower lows. A modest rebound from oversold conditions does not, by itself, establish that the market has found a durable bottom.
The more important question is why Gold continues to struggle even as Treasury yields have fallen, and whether the recent acceleration in selling reflects a new stage of financial-market stress.
Follow Gold’s next moves and the Fed’s December path on the ActionForex Telegram channel.
Global Tightening: The Headwind That Has Not Gone Away
The first part of Gold’s problem lies in the changing monetary policy environment.
Higher energy prices have revived inflation concerns across major economies, leaving central banks with limited room to consider easing even as economic growth and financial markets show signs of strain. For a non-yielding asset such as Gold, expectations of higher policy rates can create a persistent disadvantage relative to interest-bearing investments.
The Fed’s October meeting illustrated the difficulty. Policymakers held the federal funds target at 3.75–4.00%, but two officials dissented in favour of an immediate increase. Subsequent comments from several Fed officials reinforced the possibility that more tightening will be needed, with December emerging as the next important policy test.
Markets currently assign around 72.6% probability to a December hike. The US 2-year Treasury yield closed Friday at 4.594%, reflecting expectations that policy rates will stay elevated, even though the market has scaled back some tightening previously anticipated beyond December.
- Fed funds target held at 3.75–4.00% in October, with two officials dissenting in favour of an immediate hike.
- December hike probability: around 72.6%.
- US 2-year Treasury yield: 4.594% at Friday’s close.
The same inflationary challenge is visible elsewhere. The BoC raised rates to 2.50% last week, while the RBA and BoE are both widely expected to deliver quarter-point increases this week. The ECB held its deposit rate at 2.50% amid continuing inflation concerns, while the BoJ maintained its normalization outlook despite keeping rates unchanged.
- BoC: raised rates to 2.50% last week.
- RBA and BoE: both widely expected to deliver quarter-point increases this week.
- ECB: held its deposit rate at 2.50%.
- BoJ: kept rates unchanged, maintaining its normalization outlook.
The common denominator is the energy shock. Brent crude is trading around $110, substantially above the levels assumed in several central banks’ earlier forecasts. Higher fuel, transport and production costs threaten to prolong inflation pressures, complicating the prospect of policy easing.
For Gold, the problem is not necessarily that every central bank will tighten aggressively. Rather, the broader monetary environment offers fewer reasons to expect an imminent return to lower interest rates.
Yet there is an apparent contradiction in Gold’s recent performance.
During October, the US 10-year Treasury yield fell approximately 36–37bps, its largest monthly decline in nearly three years according to the supplied research. Gold nevertheless suffered substantial losses over the same period.
Normally, falling yields would be expected to provide at least some support for bullion by reducing the opportunity cost of holding a non-yielding asset. This time, the relationship has been much less straightforward.
One possible explanation is that Gold is responding more to the expected path of short-term monetary policy and broader financial conditions than to the decline in nominal long-term yields alone. The prospect of another Fed hike remains firmly priced, while energy-driven inflation continues to complicate the policy outlook.
However, without fresh real-yield data, it would be premature to claim that the interest-rate channel fully explains the decline. That limitation becomes even more important when examining Friday’s market behaviour.
When Financial Stress Turns Gold Into Something to Sell
Friday’s selloff looked unusual because Gold fell sharply without the conventional accompanying pressure from a surging Dollar or rising Treasury yields.
Nasdaq lost 2.86%, S&P 500 declined 1.82%, and semiconductor shares experienced particularly heavy selling. At the same time, Gold plunged 3.61%, Silver lost 5.82%, and Platinum fell 3.52%.
The Dollar Index, however, increased only 0.11%, while Treasury yields did not rise.
- Equities: Nasdaq −2.86%, S&P 500 −1.82%, with semiconductors hit hardest.
- Precious metals: Gold −3.61%, Silver −5.82%, Platinum −3.52%.
- Dollar Index: only +0.11%, and Treasury yields did not rise.
That combination raises an important possibility: some investors may have been selling precious metals not because their outlook for Gold had fundamentally changed that day, but because they needed to reduce positions or obtain liquidity elsewhere.
Reuters reported that the technology-market selloff had contributed to margin calls and the sale of assets including Gold. Similar explanations had surfaced during the October 22–23 decline, when bullion first slipped below $4,000.
The mechanism is plausible. When a sharp equity correction creates losses or increases margin requirements, investors may need to raise cash quickly. Liquid assets can become sources of funds regardless of their longer-term investment characteristics.
That can temporarily reverse the usual relationship between financial stress and assets associated with defensive positioning. Instead of buying Gold as protection against uncertainty, investors may sell it to meet immediate liquidity needs.
But this interpretation needs a qualification. The supplied evidence does not include direct futures-positioning data, ETF flows, open-interest changes or margin records sufficient to establish the scale of forced liquidation. The market behaviour is consistent with broader position reduction, and Reuters has reported margin-call-related selling, but the exact contribution remains unconfirmed.
The distinction between the underlying trend and the latest acceleration is also important.
Gold’s downtrend began long before the most recent technology-market correction. The metal has fallen roughly 30% from its January peak, so the latest equity weakness cannot explain the entire move.
What liquidation may explain is why the downward pressure has become more intense, particularly as selling spreads across several asset classes at once.
The recent chronology offers some support for that interpretation.
During the October 15–16 technology-led selloff, Gold still managed to finish the week higher. Since then, however, it has lost approximately 7%, while Silver and Platinum have fallen even more sharply.
That suggests the relationship between precious metals and financial-market stress may be changing. What initially looked like a potential source of defensive demand has increasingly become another area of selling pressure.
Silver’s performance is especially revealing. Its sharper losses pushed the Gold/Silver ratio higher, indicating that the more volatile metal was bearing a disproportionate share of the decline. Although Silver recovered above $50 on Monday, the rebound has yet to erase Friday’s damage.
The broader concern is whether this pattern reflects temporary portfolio adjustment or the beginning of more persistent financial-market deleveraging.
Monday’s Bounce: Relief From Oversold Conditions, Not Yet a Change in Trend
Gold’s recovery toward 3,907 on Monday offered some respite after Friday’s sharp decline. Silver also rebounded, rising back above the $50 threshold that had failed to hold during the previous session.
The recovery is understandable from a technical perspective. Gold’s daily RSI has fallen toward 33, while its 4-hour RSI is similarly depressed. Silver is even more oversold, with its daily RSI below 30.
Such conditions can produce sharp countertrend rebounds as immediate selling pressure eases and traders cover short positions.
Softer oil prices may also have helped sentiment by reducing near-term concerns about another inflationary impulse. However, the available evidence does not show a corresponding shift in the Fed’s December tightening expectations or a decisive change in short-term Treasury yields and Dollar conditions.
That makes Monday’s recovery more consistent with a relief bounce than the beginning of a confirmed bullish reversal.
For a more durable improvement, Gold would need evidence that the forces behind its decline are weakening. That could include a meaningful reassessment of monetary tightening expectations, reduced selling across risk assets, or direct positioning data indicating that liquidation pressures are subsiding.
So far, the technical charts provide little indication that such a shift has occurred.
ActionForex’s Technical View: Gold, an Orderly Decline That Could Become Something More Serious
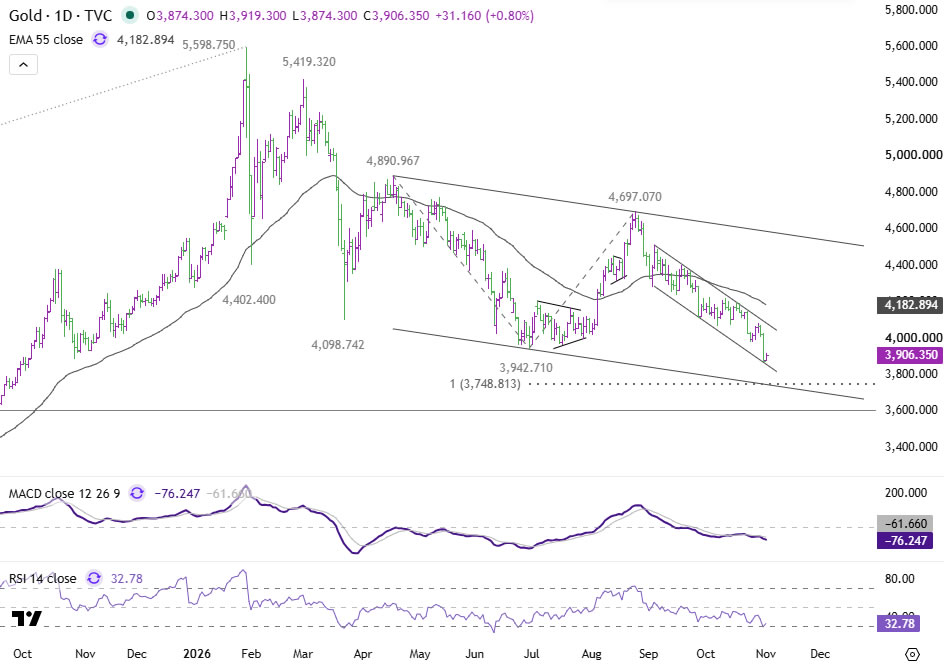
Gold’s break below 3,942.71 is technically significant because it indicates that the broader downtrend from the January high at 5,598.75 is resuming.
The subsequent rebound has not changed that interpretation. While oversold conditions may support further near-term recovery attempts, the outlook will remain bearish as long as 4,083.41 resistance holds.
The next important downside objective is 3,748.81, the 100% projection of the decline from 4,890.96 to 3,942.71, measured from the subsequent high at 4,697.07.
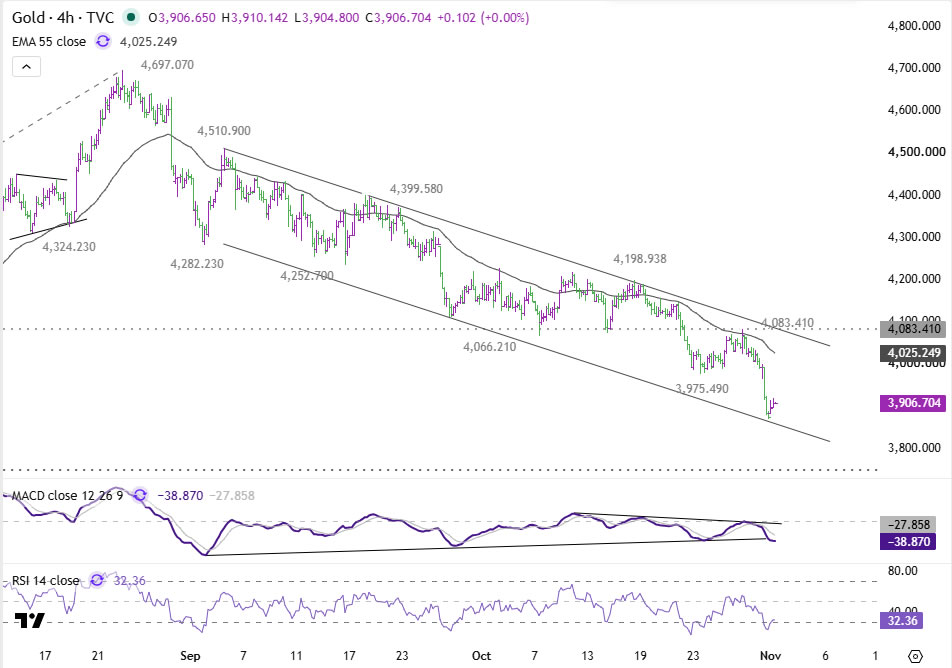
However, the most interesting feature of the current technical structure is not simply the next downside target. It is the manner in which Gold has been declining.
Since early September, prices have been moving within a relatively well-defined falling channel on the 4-hour chart. Successive rallies have been contained by the upper boundary, while selling has generally developed toward the lower boundary without establishing a sustained break beneath it.
Despite Friday’s unusually sharp losses, the broader short-term price structure still suggests an orderly decline rather than an uncontrolled selloff.
That distinction could become critical in the coming sessions.
As long as Gold stays within the channel, further weakness toward 3,748.81 would be consistent with the existing downward trajectory. The market would remain bearish, but the decline would still be developing within an identifiable technical structure.
A sustained break below the channel floor, however, would suggest that selling pressure is accelerating beyond the pace established during recent weeks.
Such a development could drive Gold through the 3,748.81 projection and bring much deeper targets into focus.
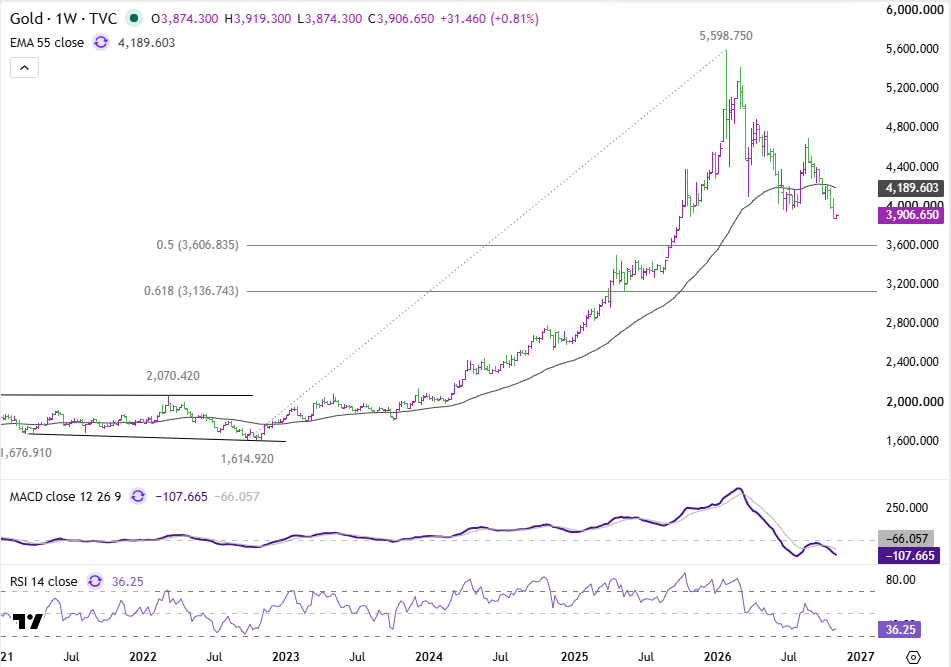
On the weekly chart, the 50% retracement of the entire advance from 1,614.92 to 5,598.75 lies at 3,606.83, followed by the 61.8% retracement at 3,136.74.
These are substantial downside objectives, and reaching them would require further deterioration beyond the current technical structure. They should therefore be treated as conditional scenarios rather than inevitable destinations.
The broader weekly indicators nevertheless reinforce the bearish outlook. Gold is trading below its 55-week EMA near 4,190, while weekly MACD remains negative and continues to deteriorate. RSI around 36 reflects persistent selling pressure, with no clear bullish divergence visible across the daily, 4-hour or weekly timeframes.
For the immediate outlook, 3,942.71 is the first level to watch on recovery attempts. A sustained move back above it would challenge Friday’s breakdown, although the more important resistance at 4,083.41 would still need to be overcome before the near-term bearish interpretation could be reconsidered.
Until then, the balance of technical risks remains tilted toward further downside.
The Next Test: Policy Repricing or Accelerating Liquidation?
The coming week may help clarify which forces are exerting the greater influence on Gold.
US manufacturing and services surveys, followed by Friday’s employment report, could change expectations for the Fed’s December decision. If incoming data reinforce the case for further tightening, Gold may continue facing pressure from the interest-rate outlook.
Conversely, weaker data could encourage markets to scale back tightening expectations. Whether Gold benefits would depend partly on the response of broader financial markets. If deteriorating growth expectations coincide with further equity losses and widespread position reduction, falling Treasury yields may again offer limited support.
That makes the behaviour of technology equities, Silver and other risk-sensitive assets particularly important.
If Gold continues falling alongside equities despite stable or declining yields, the case for liquidation-related pressure would strengthen. Direct evidence from positioning reports, ETF flows and margin activity would help determine whether that interpretation is justified.
The technical channel offers another way to assess whether the nature of selling is changing.
Gold’s decline remains orderly for now, but that does not make it harmless. The break below $4,000 and 3,942.71 has confirmed renewed downside pressure, while Monday’s recovery has so far done little more than relieve oversold conditions.
The next major objective is 3,748.81. A sustained break of the falling channel floor would warn that selling is becoming more aggressive, potentially exposing 3,606.83 and eventually 3,136.74.
The broader lesson is that Gold is facing two different forms of pressure. Global monetary tightening continues to challenge its investment appeal, while financial-market stress may be adding another reason for investors to sell.
Until the policy outlook changes or evidence emerges that liquidation pressures are easing, Monday’s rebound is better viewed as relief within an established downtrend than the start of a convincing recovery.
Key Takeaways
- Gold plunged 3.61% to 3,875.19 on Friday, its first decisive daily close below $4,000, and sits roughly 30% below its January peak of 5,598.75.
- Markets assign around 72.6% probability to a December Fed hike, and Brent near $110 keeps central banks leaning toward tighter policy.
- Friday’s selloff came with only a 0.11% Dollar Index gain and no rise in Treasury yields, consistent with margin-call and position-reduction selling, though direct positioning data is lacking.
- Monday’s bounce toward 3,907 is consistent with a relief rally from oversold conditions, with resistance at 3,942.71 and 4,083.41.
- The next downside objective is 3,748.81; a sustained break of the falling channel floor would expose 3,606.83 and 3,136.74.
Stay ahead of Gold’s next move as global tightening and liquidation risks collide—join the ActionForex Telegram channel for regular market updates and analysis.