


Eurozone goods trade recorded a €10.3B deficit in September 2026, reversing a €13.5B surplus a year earlier, according to Eurostat. Exports increased 6.0% yoy to €272.7B, but imports surged 16.1% to €283.0B, reflecting a substantial imbalance between the growth of external sales and purchases. The deterioration was driven primarily by a widening energy deficit, which increased from €20.7B to €33.0B, alongside a narrowing machinery and vehicles surplus from €10.0B to €3.0B. Although the unadjusted deficit improved from €16.6B in August, the seasonally adjusted balance deteriorated from a €7.8B deficit to €8.7B, suggesting that the underlying monthly trade position weakened slightly.
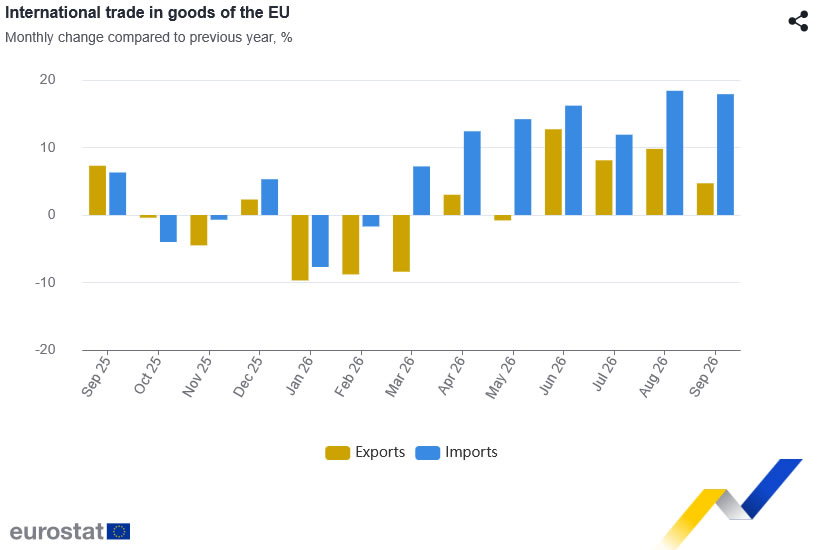
The broader European Union recorded a €16.8B trade deficit, compared with an €11.4B surplus in September 2025, as exports rose 4.7% yoy while imports jumped 17.9%. The €28.2B deterioration was not solely an energy story, as Europe’s traditional manufacturing trade surpluses also narrowed considerably. The EU energy deficit widened from €24.1B to €37.6B, accounting for almost half of the overall deterioration. Meanwhile, the machinery and vehicles surplus shrank from €13.1B to €3.3B, with imports rising 22.5% against export growth of 8.0%. The chemicals surplus also declined from €26.0B to €19.0B, as chemical exports contracted 13.5%. Together, these developments reduced the EU’s manufactured goods surplus from €32.4B to €15.8B.
Trade performance with major partners highlighted further pressures. The EU’s surplus with the US nearly halved from €21.3B to €10.9B, as exports to the US fell 10.6% yoy while imports increased 14.7%. Its deficit with China widened from €35.2B to €41.7B, reflecting a 12.2% increase in imports against a 1.4% decline in exports. The deficit with Norway also expanded from €2.1B to €6.3B amid a 60.1% surge in imports, consistent with the broader rise in energy import costs. In contrast, trade surpluses with the UK and Switzerland improved. The wider deterioration extended well beyond a single month: during January–September, the Eurozone shifted from a €102.2B surplus in 2025 to a €36.5B deficit in 2026, while the EU moved from an €85.5B surplus to an €83.2B deficit. The figures underscore the combined pressure of higher import costs and weakening manufacturing trade balances, although nominal trade values alone cannot distinguish price effects from changes in traded volumes.
Data Summary — Eurozone and EU Trade Balance
September 2026 — Non-Seasonally Adjusted
| Indicator | Sep 2026 | Sep 2025 |
|---|---|---|
| Eurozone Trade Balance | -€10.3B | +€13.5B |
| Eurozone Exports (yoy) | +6.0% | — |
| Eurozone Imports (yoy) | +16.1% | — |
| EU Trade Balance | -€16.8B | +€11.4B |
| EU Exports (yoy) | +4.7% | — |
| EU Imports (yoy) | +17.9% | — |
EU Trade Balance by Product
| Product | Sep 2026 | Sep 2025 |
|---|---|---|
| Energy | -€37.6B | -€24.1B |
| Machinery & Vehicles | +€3.3B | +€13.1B |
| Chemicals | +€19.0B | +€26.0B |
| Manufactured Goods | +€15.8B | +€32.4B |
EU Trade Balance by Major Partner
| Trading Partner | Sep 2026 | Sep 2025 |
|---|---|---|
| United States | +€10.9B | +€21.3B |
| China | -€41.7B | -€35.2B |
| United Kingdom | +€18.7B | +€16.1B |
| Switzerland | +€9.0B | +€6.8B |
| Norway | -€6.3B | -€2.1B |
Key Takeaways
- Eurozone trade reversed from a €13.5B surplus to a €10.3B deficit, as import growth significantly outpaced exports.
- The EU’s trade deterioration extended beyond energy, with machinery, vehicles and chemicals contributing to a substantial reduction in manufacturing surpluses.
- EU trade balances weakened sharply with the US and China, while stronger surpluses with the UK and Switzerland provided some offset.