


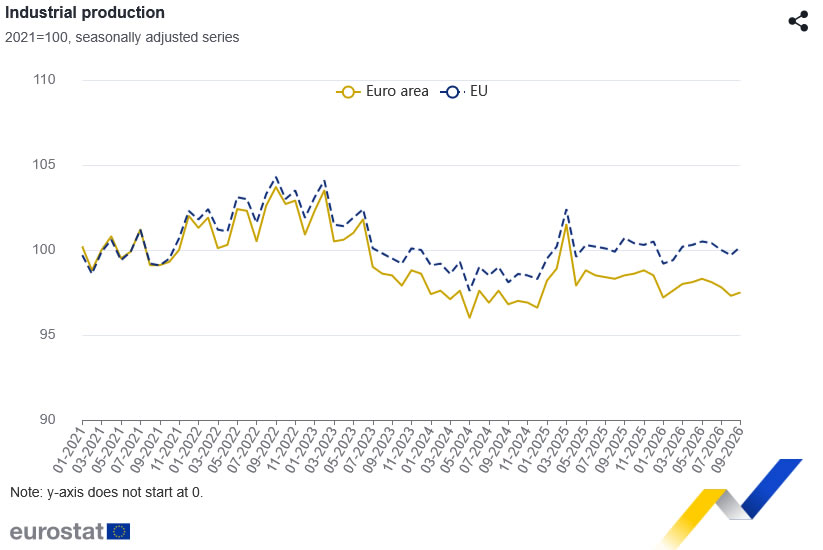
Eurozone industrial production returned to modest growth in September, rising 0.2% mom after a 0.5% contraction in August, but fell short of market expectations for a 0.3% increase. The rebound ended three consecutive months of declining output, although annual production deteriorated further, with the contraction deepening from 1.1% to 1.5% yoy. Across the broader EU, industrial production rose 0.5% mom following a 0.3% decline in August, while annual output fell 0.8%. The divergence between the eurozone’s modest monthly improvement and worsening annual performance suggests that industrial activity is showing tentative signs of stabilization rather than a sustained recovery.
The sector breakdown revealed uneven performance. Intermediate goods production rebounded from a 0.7% decline to 0.7% growth mom, while durable consumer goods output improved from -0.1% to 1.3%. However, energy production fell 1.7%, reversing the previous month’s marginal 0.1% decline into a substantially sharper contraction, while capital goods output stagnated after rising 0.7% in August. Non-durable consumer goods production declined another 0.4%, following consecutive 2.8% monthly falls in July and August. On an annual basis, non-durable consumer goods remained the weakest category, contracting 7.5%, highlighting persistent weakness in an important segment of industrial activity.
Performance also varied significantly across major economies. Germany’s industrial production growth accelerated from 1.0% to 1.3% mom, while Italy rebounded from a 1.2% contraction to 1.2% growth and Spain recovered from -0.8% to 0.9%. France, however, recorded a second consecutive monthly decline of 0.5%, while Ireland’s output plunged 5.5% for a second straight month, leaving annual production down 19.1%. The contrasting national performances help explain why improving activity in several major economies translated into only a limited eurozone rebound. With industrial output still below its May level and annual production contracting more sharply, September’s figures provide insufficient evidence that the sector has established a durable recovery.
Data Summary — Eurozone Industrial Production (September 2026)
Headline Industrial Production
| Indicator | Sep | Exp. | Aug |
|---|---|---|---|
| Eurozone industrial production (mom) | +0.2% | +0.3% | -0.5% |
| Eurozone industrial production (yoy) | -1.5% | — | -1.1% |
| EU industrial production (mom) | +0.5% | — | -0.3% |
| EU industrial production (yoy) | -0.8% | — | -0.1% |
Eurozone Industrial Components — Monthly
| Component | Sep | Aug | Trend |
|---|---|---|---|
| Intermediate goods | +0.7% | -0.7% | Rebounded |
| Energy | -1.7% | -0.1% | Decline deepened |
| Capital goods | 0.0% | +0.7% | Stagnated |
| Durable consumer goods | +1.3% | -0.1% | Rebounded |
| Non-durable consumer goods | -0.4% | -2.8% | Decline moderated |
Major Eurozone Economies — Monthly
| Country | Sep | Aug |
|---|---|---|
| Germany | +1.3% | +1.0% |
| France | -0.5% | -0.4% |
| Italy | +1.2% | -1.2% |
| Spain | +0.9% | -0.8% |
| Netherlands | -0.2% | +2.5% |
| Ireland | -5.5% | -5.5% |
Key Takeaways
- Modest rebound misses expectations: Eurozone industrial production rose 0.2% mom in September after three consecutive monthly declines, but missed the 0.3% forecast as annual output contracted further by 1.5%.
- Industrial improvement remains uneven: Intermediate and durable consumer goods recovered, while energy production fell sharply, capital goods stagnated and non-durable consumer goods remained weak.
- Divergent national performances cloud recovery: Germany, Italy and Spain recorded stronger production, but continued weakness in France and a sharp Irish contraction limited the broader improvement.