


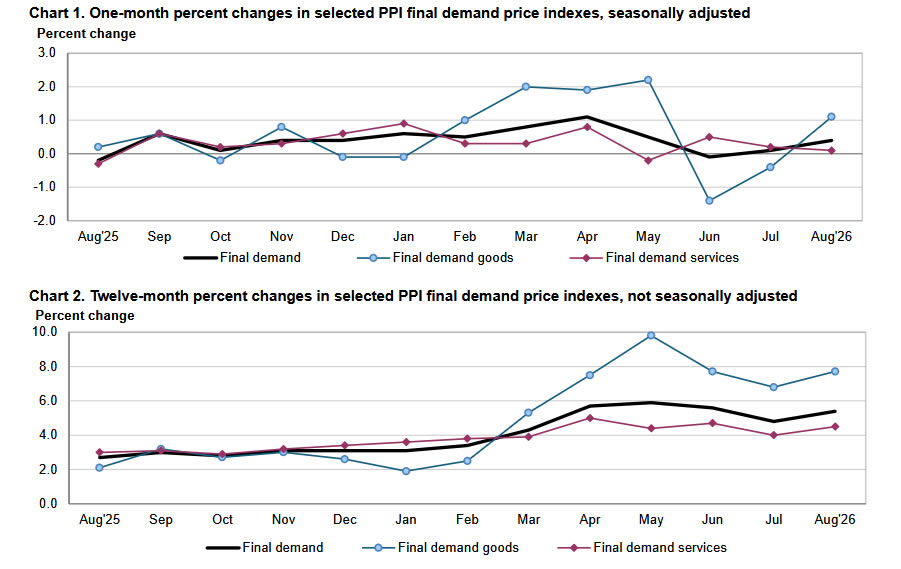
US producer prices accelerated in August, with final-demand PPI rising from 0.1% to 0.4% m/m, matching consensus, while the annual rate reached 5.4%, slightly above the 5.3% forecast. The underlying measure excluding food, energy and trade services eased from 0.4% to 0.3% m/m, but still stood at 4.7% y/y, indicating that broader producer-price pressure remained elevated even as monthly core momentum moderated.
The monthly increase was led by goods, which swung from -0.4% to +1.1%, while services slowed from 0.2% to 0.1%. More than three-quarters of the goods increase came from energy, where prices rose 4.2%, including a 24.1% jump in diesel fuel. Goods excluding food and energy still increased 0.4%, while food prices edged up 0.1%. Within services, transportation and warehousing prices rose 2.3%, but trade services fell 0.2% and other services were unchanged.
Pressure was also visible further up the production pipeline. Processed goods for intermediate demand reversed from -0.4% to +1.8% m/m and were up 11.5% y/y, with processed energy prices rising 7.3%. Unprocessed intermediate goods accelerated from 0.7% to 1.1% m/m and stood 12.8% higher y/y, while intermediate-demand services rose from 0.1% to 0.3%. The August report was therefore heavily influenced by energy, but elevated intermediate-goods inflation shows that upstream cost pressure extends beyond the final-demand headline.
Data Summary
| Indicator | Previous | Current | Expected |
|---|---|---|---|
| PPI Final Demand m/m | 0.1% | 0.4% | 0.4% |
| PPI Final Demand y/y | 4.8% | 5.4% | 5.3% |
| PPI ex-food, energy & trade services m/m | 0.4% | 0.3% | |
| PPI ex-food, energy & trade services y/y | 4.7% | 4.7% |
The official BLS release shows final-demand PPI rising 0.4% m/m and 5.4% y/y, while the measure excluding food, energy and trade services slowed from 0.4% to 0.3% m/m and remained at 4.7% y/y.
Components
| Component | Previous | Current |
|---|---|---|
| Final demand goods m/m | -0.4% | 1.1% |
| Final demand energy m/m | -1.8% | 4.2% |
| Final demand goods ex-food & energy m/m | 0.2% | 0.4% |
| Final demand foods m/m | -0.9% | 0.1% |
| Final demand services m/m | 0.2% | 0.1% |
| Transportation & warehousing services m/m | -1.1% | 2.3% |
| Processed intermediate goods m/m | -0.4% | 1.8% |
| Unprocessed intermediate goods m/m | 0.7% | 1.1% |
| Intermediate-demand services m/m | 0.1% | 0.3% |
Energy accounted for more than three-quarters of the final-demand goods increase, with diesel fuel jumping 24.1%. Services were much softer overall, although transportation and warehousing costs rebounded sharply. Intermediate-goods pressures were also substantial, with processed goods up 11.5% y/y and unprocessed goods up 12.8% y/y.
Key Takeaways
- US final-demand PPI accelerated from 0.1% to 0.4% m/m, matching consensus, while the annual rate rose from 4.8% to 5.4%, slightly above the 5.3% forecast.
- The monthly increase was heavily energy-led. Final-demand goods rebounded from -0.4% to 1.1%, with energy up 4.2% and diesel fuel surging 24.1%.
- Underlying monthly pressure was less forceful: PPI excluding food, energy and trade services eased from 0.4% to 0.3%, although the annual rate remained elevated at 4.7%.
- Services rose just 0.1%, but transportation and warehousing jumped 2.3%, showing some of the energy and freight pressure moving through distribution costs.
- Pipeline pressure remained substantial, with processed intermediate goods up 11.5% y/y and unprocessed intermediate goods up 12.8% y/y.
- Overall, August was not a generalized services inflation surge, but the combination of higher energy prices and elevated intermediate-input costs leaves little evidence of meaningful upstream price relief.





