
Euro surged sharply for the initial part of last week as boosted by the result of French president election. The common currency ended the week as the strongest major currency. But it has clearly lost some momentum after a balanced ECB press conference. On the other hand, Sterling continued to defy gravity and picked up momentum again towards the end of the week. The British Pound has indeed ended April as the strongest major currency for the month. The weakness in the Japanese Yen might take some attention. But it was the selloff in commodity currencies, in a risk-seeking environment, that is worth the watch. Meanwhile, Dollar found no support from US President Donald Trump’s tax plan, but it didn’t react negatively to Q1 GDP miss neither.
French election watched again, but result should be priced in
EU leaders gathered on Saturday in a summit and approved the Brexit negotiation guidelines unanimously. The terms were basically the same as what were reported. And, based on the lack of negative reaction to Brexit news by Sterling, we’d expect the news to be shrugged off. Meanwhile, France will have the run-off election next Sunday on May 7. Such event will definitely get much attention from the markets. But for now, it looks like a done deal for centrist, pro-euro, Emmanuel Macron to win and become the next French President. Hence, the result should be well priced in.
FOMC and NFP are the focuses
The focus should turn back to a busy week in the US, with FOMC meeting and non-farm payroll featured. At this point, the base case for Fed remains unchanged. That is, Fed will continue with it’s plan of a total of three rate hikes this year. That would be followed by a "brief pause" as Fed starts shrinking its balance sheet later in the year. Markets are pricing in over 60% chance of a rate hike by Fed in June. It’s generally believed Fed will look past the weaker than expected Q1 GDP data. The key will now be on how the US economic bounce back in in Q2. And the set of ISM indices for May and NFP for April will be crucial.
Prospect of a dip in Dollar index before rebound
Dollar index suffered steep decline initially last week thanks to the strength in Euro. But the index then turned sideway. At this point, we’re viewing the fall from 101.34 as part of the corrective pattern from 103.82. If our view is correct, such pattern is likely a triangle pattern too. There is prospect of another dip but there should be strong support above 50% retracement of 91.91 to 103.82 at 97.86 to bring rebound.
10 year yield might go down before up
Ideally, the rebound in Dollar index should be accompanied by corresponding rise in treasury yields. TNX’s rebound failed to break through 55 day and EMA and 2.391 resistance last week. There is prospect of another fall. But there is no change in the view that price actions from 2.621 are a corrective move. Hence, even in case of a deeper fall, downside should be contained by 38.2% retracement of 1.336 to 2.621 at 2.130 to bring rebound.
DJIA should limited below record high
In the US stock markets, NASDAQ extended the record run last week. But both DJIA and S&P 500 showed hesitation ahead of record highs. DJIA was limited below 21169.1 and retreated. But the pattern from 21169.11 to 20379.55 does suggest it’s a completed correction. Hence, we’re favoring another rally ahead through 21169.11 in near term. But break of 20792.20 support will dampen our view and extend recent consolidation instead. And we’d maintain the preference to see strength in stocks, yields and Dollar to confirm the underlying bullishness and optimism in the US economy.
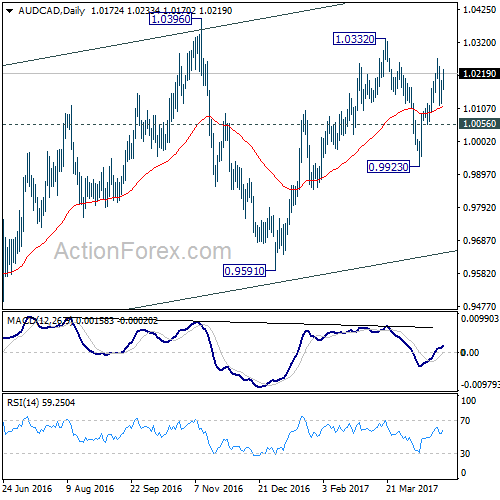
Aussie out-performed Canadian…
We’ve talked about the weakness in commodity currencies above. Comparing them, we’d see that AUD/CAD’s pull back from 1.0332 has clearly completed at 0.9923 already. Last week’s brief retreat was contained above 55 day EMA, and thus, maintains some near term bullishness. It should also be noted that 0.9923 also coincide with 55 week EMA back then. Hence for now, we’d expect further rise in the cross as long as 1.0056 support holds, for 1.0332. And the medium term choppy rise from 0.9148 would likely resume through 1.0396 high.
…and Kiwi too
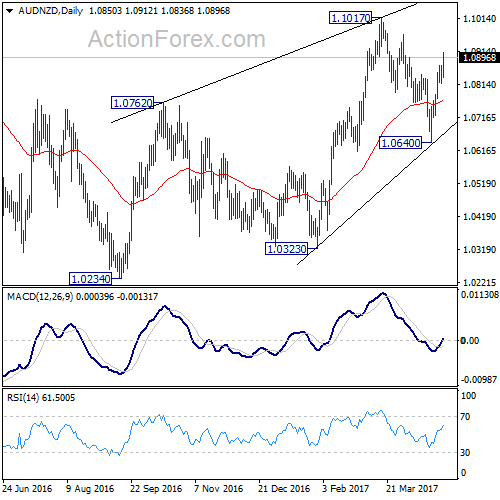
AUD/NZD’s pull back from 1.1017 should also be completed at 1.0640 after drawing support from 55 week EMA. Rise from 1.0234 is likely resuming through 1.1017. Also, the medium term fall from 1.1638 should be completed as a three wave correction to 1.0234. Hence, there is prospect of targeting a test on 1.1331 resistance at least. For now, from the outlook of AUD/CAD and AUD/NZD, Aussie is not the one to sell against other major currencies.
To buy GBP/JPY and USD/CAD on dips
Regarding trading strategy, firstly, we’d expect Sterling to continue to outperform Euro. Secondly, there is prospect of a reversal in Dollar, but it may not be ready yet. Yen’s weakness is expected to continue on risk appetite and also concerns on tension in North Korea. Commodity currencies would likely stay weak but Aussie should be avoided. Between Canadian Dollar and New Zealand Dollar, we’ll choose the former for the uncertain trade relationship with US and weakness in oil price.
Hence, we’ll try to buy GBP/JPY on a dip to 142.00 this week, with a stop at 140.00. We’d expect GBP/JPY to target 148.42 high and above. Meanwhile, we’ll also try to buy USD/CAD on a dip to 1.3500, with a stop at 1.3400. We expect USD/CAD to extend the medium term rise from 1.2460 to 1.3838.
GBP/JPY Weekly Outlook
GBP/JPY rose sharply to as high as 144.48 last week. The development should have confirmed our view that consolidation pattern from 148.42 has completed at 135.58, ahead of 135.39 medium term fibonacci level. Further rise should be seen through 148.42 ahead.
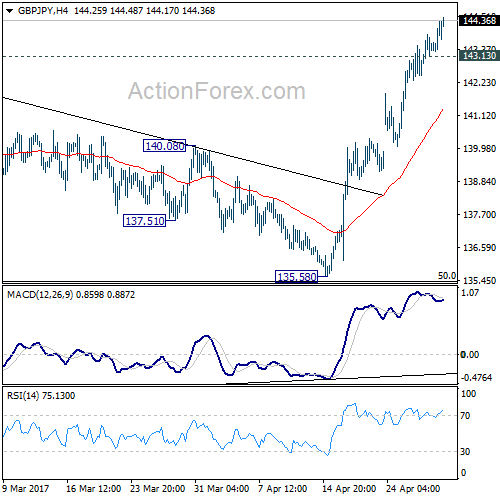
Initial bias in GBP/JPY remains on the upside this week. Break of 144.77 resistance will likely resume the whole rebound from 122.36 through 148.42 resistance. On the downside, break of 143.13 minor support will turn bias neutral and bring consolidation before staging another rally.
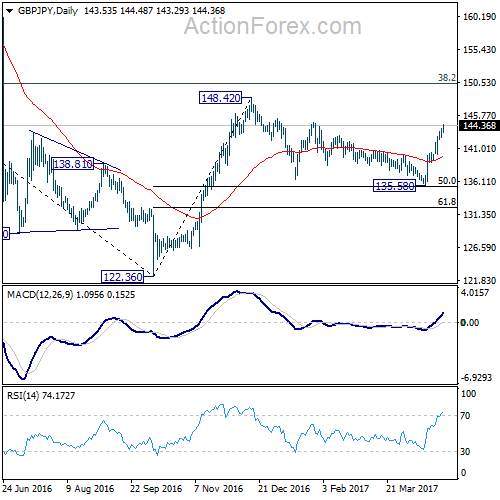
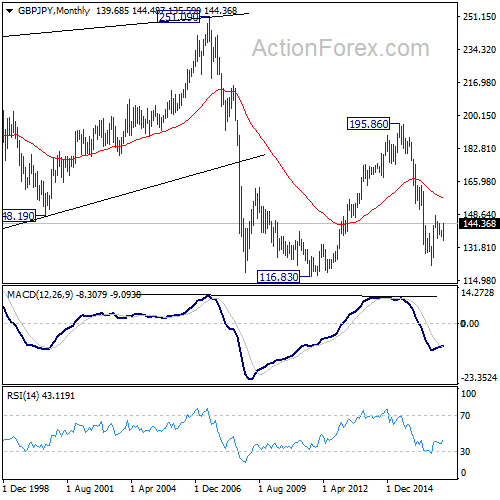
In the bigger picture, based on current momentum, rise from 122.36 bottom should be developing into a medium term move. Break of 38.2% retracement of 195.86 to 122.36 at 150.42 should pave the way to 61.8% retracement at 167.78. This will now be the favored case as long as 135.58 support holds.
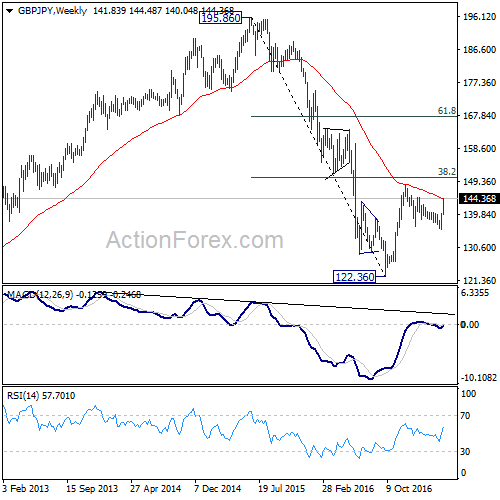
In the longer term picture, based on the impulsive structure of the decline from 195.86 to 122.36, such fall should be completed yet. But we will now pay close attention to the structure of the rise from 122.36 to determine whether it’s a corrective move, or an impulsive move. That would decide whether a break of 116.83 low would be seen.


