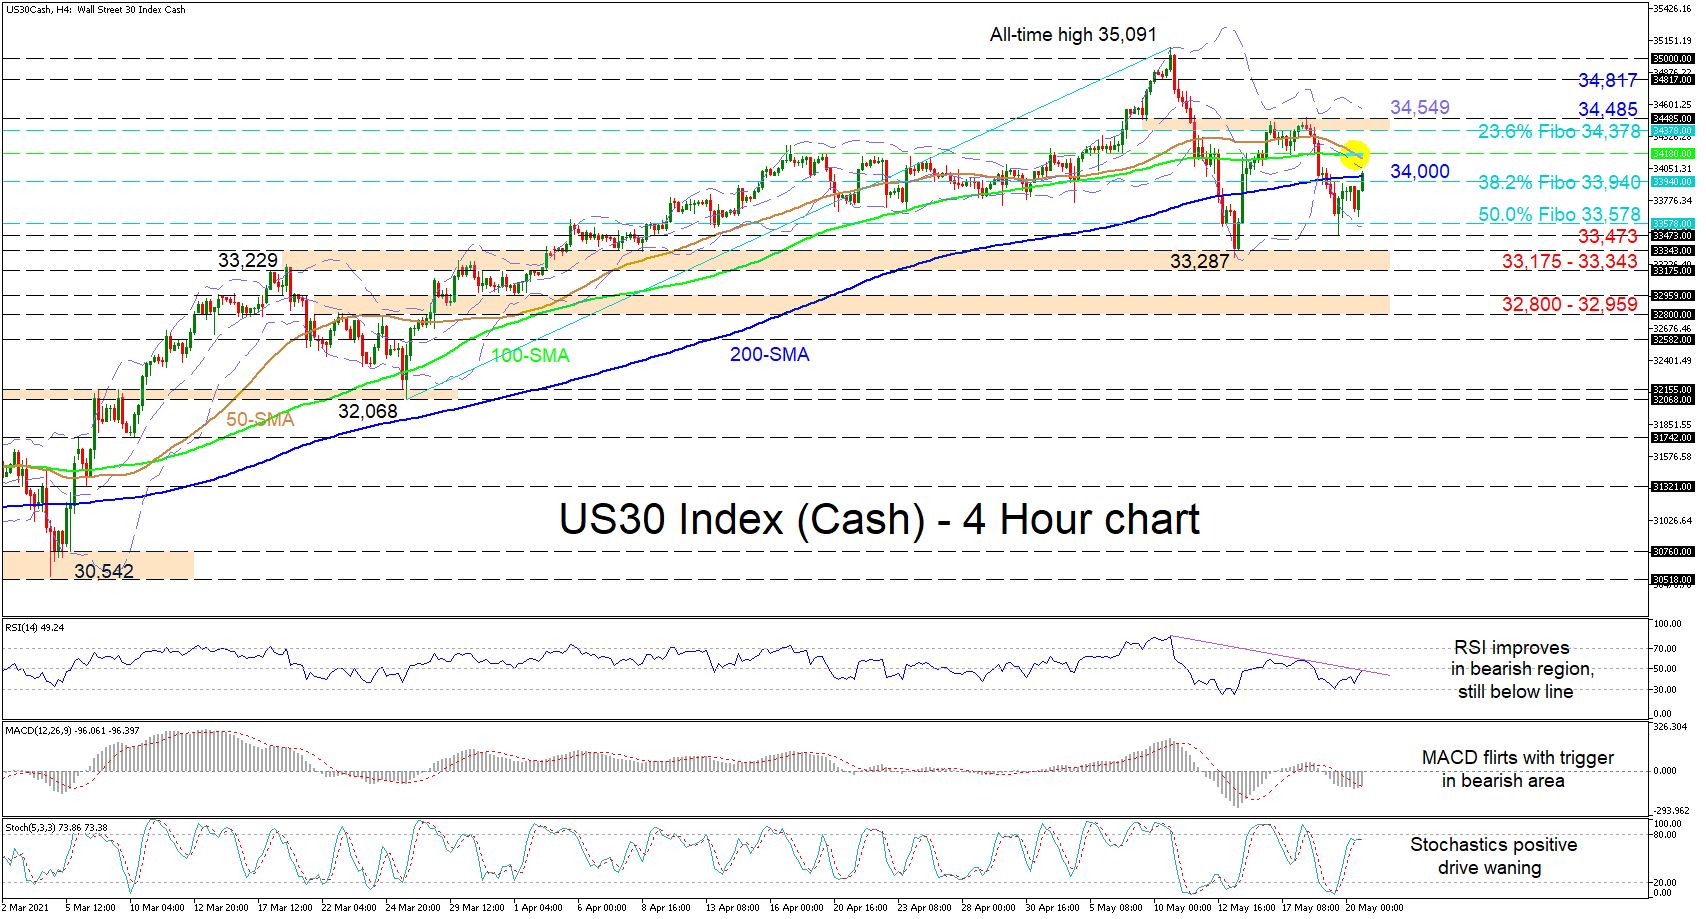
The US 30 stock index (Cash) is struggling to return above the 200-period simple moving average (SMA) after the strong downward correction off of its all-time high of 35,091. The diving 50-period SMA and its freshly completed bearish crossover of the hovering 100-period SMA is signalling that the index’s positive sentiment is currently lacking. The dwindling slopes of the 100- and 200-period SMAs are promoting a price consolidation phase.
Nonetheless, the technical indicators are currently favouring a short-term neutral-to-bearish demeanour as the price remains curbed around the 200-period SMA. The MACD is in the bearish region and is working to clearly conquer the red trigger line. The RSI has improved near the 50 threshold but has yet to nudge above it and the overlapping restrictive line. The stalling stochastic oscillator is signalling the absence of essential bullish impetus to redirect the index back up.
Currently price improvements remain subdued by the 33,940 barrier and the adjacent 200-period SMA at 34,000, the former being the 38.2% Fibonacci retracement of the up leg from 32,068 until 35,091. Should this scenario persist, initial downside limitations may develop between the vicinity of the 50.0% Fibo of 33,578 and the low at 33,473. Assuming the index fades further, the key support section of 33,175-33,343 could try to defend the broader positive structure. However, if the index surrenders extra ground, this may propose the price is prepared to steer for the 32,800-32,959 boundary.
To the upside, more intense buying interest would be essential to propel the price past an immediate resistance zone from the 200-period SMA at 34,000 until the 100-period SMA at 34,180. Surpassing these limiting obstacles could then extend the index to challenge a durable border between the 23.6% Fibo of 34,378 and the 34,485 high. Successfully triumphing over this and the upper Bollinger band at 34,549 overhead, buyers may then meet the 34,817 barrier.
Summarizing, as long as the price holds below the 34,485 level, the overall correction in the index remains heavy on the price, strengthening to a degree the neutral-to-bearish picture. A push over 34,180 may slightly boost market optimism.