
EUR/USD has had an interesting start to 2026. US Dollar strength has kept the pair on a downward trajectory from December 24, 2025 highs around the 1.1800 handle.
Since then, EUR/USD has fallen around 140 pips to a low of around the 1.1660 level yesterday with the potential for further downside still a possibility.
US Dollar Seasonality to Play a Role?
Despite all the talk and concern around the US Dollar, January is historically a positive month for the greenback. With that in mind, this could work in favor of another leg to the downside for EUR/USD.
The US Dollar has risen at the start of the year and this week as well, but this was largely attributed to a spike in haven demand after the US/Venezuela tensions over the weekend.
I do expect the US dollar to gain a bit of strength in the near-term and this feeds in to the trade setup for EUR/USD.
My reasoning is simply down to seasonality as well as the fact that market participants seem too relaxed about global political conflicts right now; if tensions suddenly flare up again, especially in Latin America or Greenland, risky investments could crash, causing traders to rush back to the safety of the dollar.
Technical Analysis on EUR/USD
Let us start with the technical picture on the four-hour chart
EUR/USD has broken the ascending wedge pattern which had been in play since Mid-November.
The breakout of the wedge pattern should lead to a drop of around 160 pips.
The pair has already dropped about a 100-pips before a pullback of around 80-pips
The price is now at the 100-day MA which is providing resistance and could be the start of the next leg to the downside.
EUR/USD Four-Hour Chart, January 6, 2026
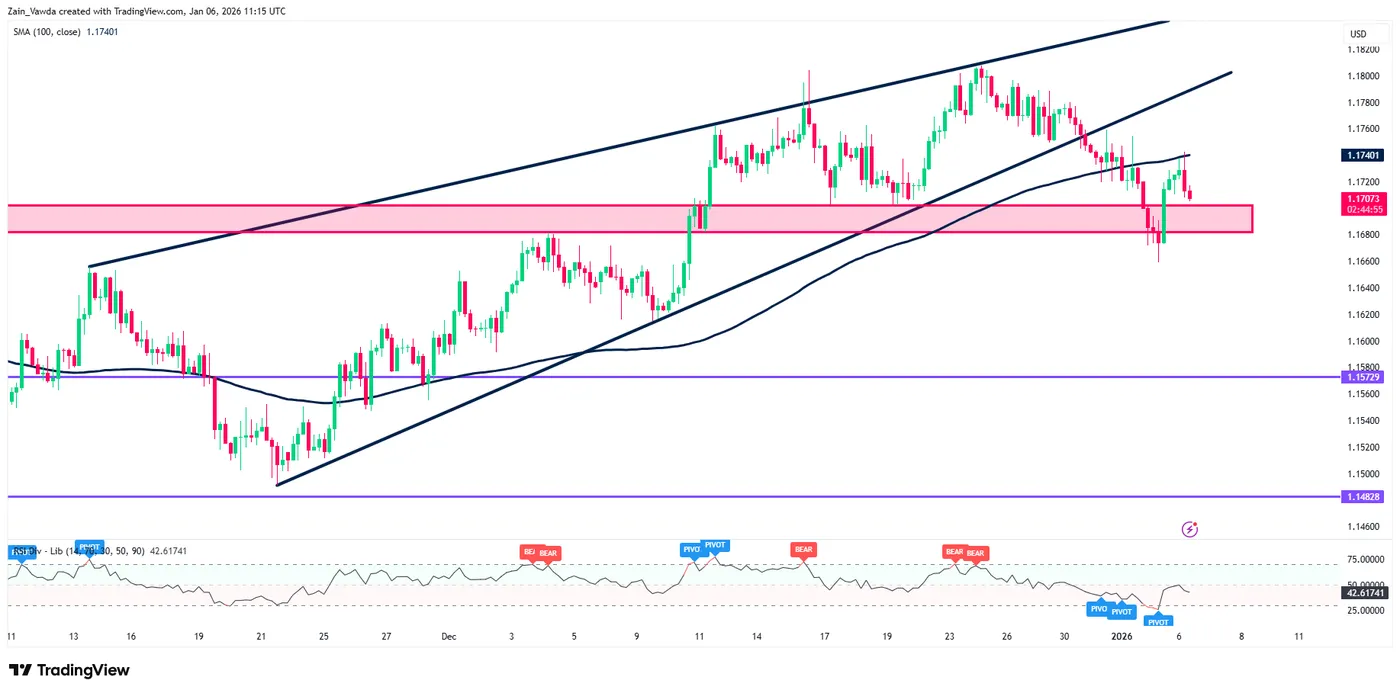
Source: TradingView.com
Dropping down to the one-hour chart below and for those looking for a better risk-to-reward there may be another opportunity to get involved.
A break below the red zone on the chart below with a potential retest of the zone could provide a tighter stop loss for those looking to get involved.
At present, only a four-hour candle close above the 1.1750 handle would lead me to re-evaluate the setup as that would mean a change in structure has taken place and the par may break to the upside and test recent highs around the 1.1800 handle.
EUR/USD One-Hour Chart, January 6, 2026
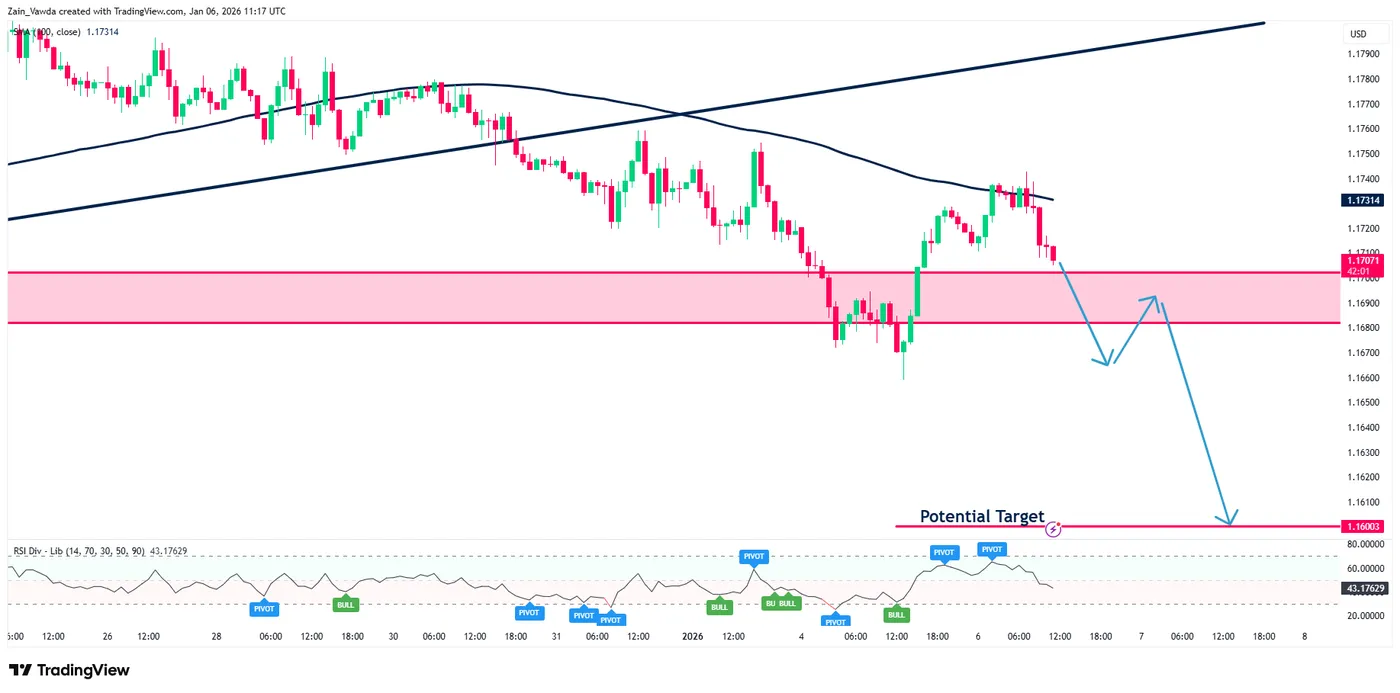
Source: TradingView.com