
As humans we love to overcomplicate things!
While an elaborate trading strategy may impress your family and friends, it is unnecessary to succeed.
For those that have been involved in the markets for a while will know that keeping things simple is a MUST in trading. And that’s why the trend line remains a favourite among the technical community.
By definition, trend lines are linear and are constructed by linking two or more price points that extends into the future to be used as support or resistance. We will not go into too much detail here regarding form since we already covered that here: How to Identify Trendlines. Our objective in this piece is to demonstrate the many uses the trend line possesses.
What happens when your trusted trend line fails?
As with all technical methods, nothing is guaranteed to work 100% of the time. Trend lines WILL fail from time to time, and when they do this tends to give way to a retest play.
As you can see on the M30 GBP/AUD chart depicted below, the trend line support recently experienced a somewhat aggressive breach to the downside. In one fell swoop the barrier was wiped out. While a loss may have been incurred, trading the underside of this level as (in this case) resistance is now a plausible option.
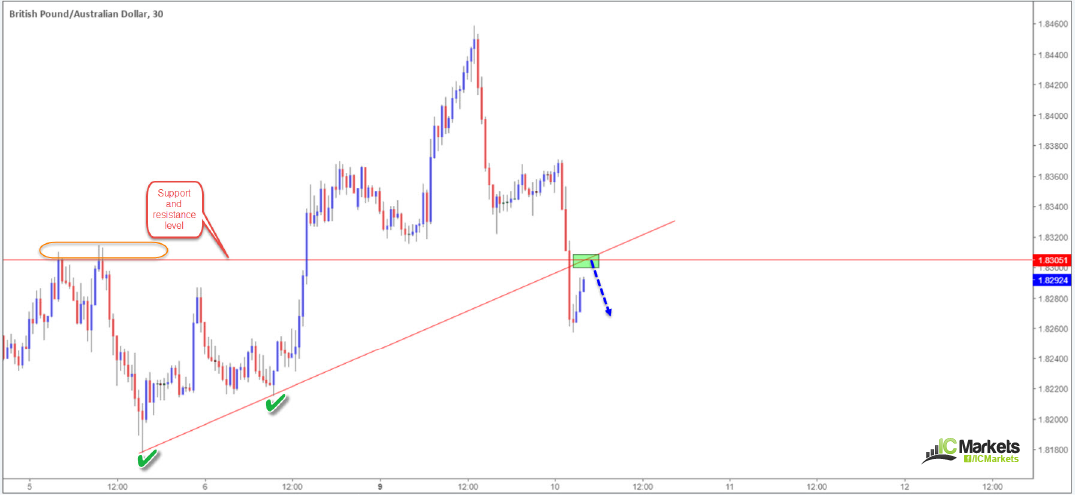
What causes a response on the retest of a broken trend line?
Well, from an order-flow perspective one could put it down to supply and demand.
One way of potentially looking at order flow here is through the eyes of pro money (generally thought to be institutional traders with particularly deep pockets):
- Those that entered into a long position off of the trend line support pictured above likely had stop-loss orders sited 10-15 pips beneath the barrier.
- Given the recent move lower, stop-loss orders have, therefore, been filled and thus become sell orders.
- Using these sell orders pro money buys into this liquidity, lifting price action higher. They do this in order to reach the unfilled sell orders left at the break of the trend line. As the initial break was strong, it’s unlikely that pro money were able to fill all of their sell orders. Remember, we are not talking 10 lots here!
- So, in order to fill these unfilled sell orders, price is bid higher and as soon as the sell orders have been triggered, pro money liquidates its initial buy orders, thus letting price push its way south.
The RSI indicator also loves a trend line!
An often overlooked, yet highly effective, method of using the RSI indicator is combining trend lines. The RSI indicator typically finds its use when the oscillator reads an overbought or oversold signal. It is also great at finding divergences. However, drawing trend lines directly over the oscillator itself is also highly effective. Connecting rising swing lows in an uptrend or lower swing highs in a downtrend, traders are able to find excellent trading opportunities.
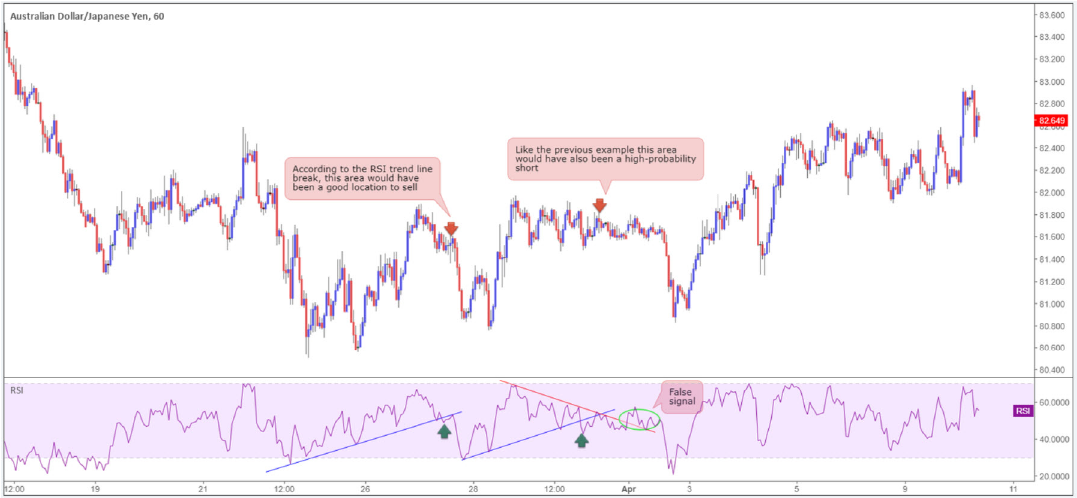
There are two solid examples of potential short trades posted on the AUD/JPY H1 chart above. Note how the break of the two ascending trend lines indicated a downside move was likely in the making, before the candles actually set off lower.
As we highlighted above, though, nothing is guaranteed in trading. As you can see, there was a false signal to the upside marked with a green circle. This is why we believe one should never trade any technical tool in isolation. Combining RSI trend lines with candlestick structure is recommended.
Not only does the RSI indicator work well with trend lines on any timeframe, it might be worth noting that it is also particularly fond of support and resistance levels as well!
Additional points to consider
- Trend lines can be great tools for trade management, potentially leading to huge gains if handled correctly. For example, imagine you’re long the EUR/USD and price has moved nicely away from the entry point and printed a higher low. At this point, you could extend a trend line using the initial reaction and newly-formed higher low as a basis for a trend line to manage the trade. A close beneath the trend line would be considered a signal to exit the position.
- Trend lines are also exceptionally good at confirming areas of interest. By way of illustration, let’s assume you have spotted a nice-looking resistance level on the H1 timeframe. You’ve noted that it has good history, but lacks technical confluence. Do you just ignore the level or trade in hope? Well, trading in hope is not how professionals approach this business! An alternative, therefore, is to wait for additional confirmation, rather than passing on what could be a profitable resistance. A trend line support break/retest play is something traders could look for. Generally, though, you’ll have to drill down to the lower timeframes in order to catch this.
As a reminder, broken trend lines are BEST traded in combination with additional technical tools. The more reasons there are to trade an area, the more likely it’ll hold.


