

Live Comments
US PPI Slows to 4.7% Y/Y as July Prices Come in Flat
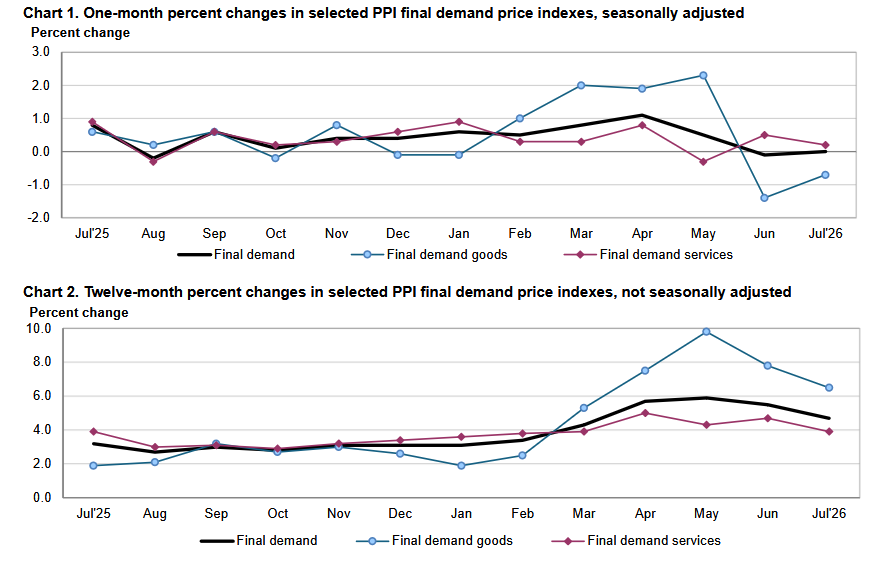
US producer inflation came in softer than expected at headline level in July, reinforcing evidence that price pressures from first oil shock are fading. PPI improved from a revised -0.1% to 0.0% m/m, below 0.2% consensus. Annual rate slowed sharply from 5.5% to 4.7%, undershooting 4.9% expected. Weakness was concentrated in goods, where prices fell -0.7% m/m, while final-demand services rose 0.2% and construction prices jumped 2.2%.
Goods breakdown was particularly soft. Energy prices fell -3.1% m/m and food declined -0.9%, while goods excluding food and energy rose just 0.1%. Services were firmer but uneven: trade services slipped -0.1% and transportation and warehousing fell -1.8%, while other services rose 0.6%. One caution came from Fed’s preferred underlying producer-price gauge excluding food, energy and trade services, which accelerated from 0.1% to 0.4% m/m, even as annual rate eased from 5.0% to 4.7%.
Overall, release strengthens case that headline pipeline inflation is cooling, but it is not an entirely dovish report. Falling energy prices did much of work at goods level, while underlying monthly measure accelerated. Combined with this week’s softer CPI, data further reduce immediate need for another Fed hike, but policymakers will be reluctant to declare victory before August figures capture latest rebound in oil prices.
Data Summary
| Indicator | Actual | Expected | Previous |
|---|---|---|---|
| PPI m/m | 0.0% | 0.2% | -0.1% |
| PPI y/y | 4.7% | 4.9% | 5.5% |
| Final Demand Goods m/m | -0.7% | — | -1.4% |
| Final Demand Services m/m | 0.2% | — | 0.5% |
| Final Demand Construction m/m | 2.2% | — | — |
| Food m/m | -0.9% | — | -0.5% |
| Energy m/m | -3.1% | — | -6.5% |
| Goods ex Food & Energy m/m | 0.1% | — | 0.2% |
| Trade Services m/m | -0.1% | — | 1.4% |
| Transportation & Warehousing m/m | -1.8% | — | -0.5% |
| Other Services m/m | 0.6% | — | 0.2% |
| PPI ex Food, Energy & Trade m/m | 0.4% | — | 0.1% |
| PPI ex Food, Energy & Trade y/y | 4.7% | — | 5.0% |
Key Takeaways
- US PPI came in softer than expected in July, moving from -0.1% to 0.0% m/m versus 0.2% expected, while annual rate slowed from 5.5% to 4.7%.
- Goods prices were main drag, falling 0.7% m/m, led by a 3.1% drop in energy and 0.9% decline in food.
- Services were firmer at 0.2% m/m, while construction prices rose 2.2%.
- Underlying picture was less dovish than headline: PPI excluding food, energy and trade services accelerated from 0.1% to 0.4% m/m, even as annual rate eased to 4.7%.
- Trade services fell 0.1% and transportation and warehousing dropped 1.8%, offsetting some strength in other services.
- Release supports case for a September Fed hold, but August PPI will be more important for judging whether renewed oil strength feeds back into broader producer costs.
Eurozone Industrial Production Stalls in June as Capital Goods Weigh
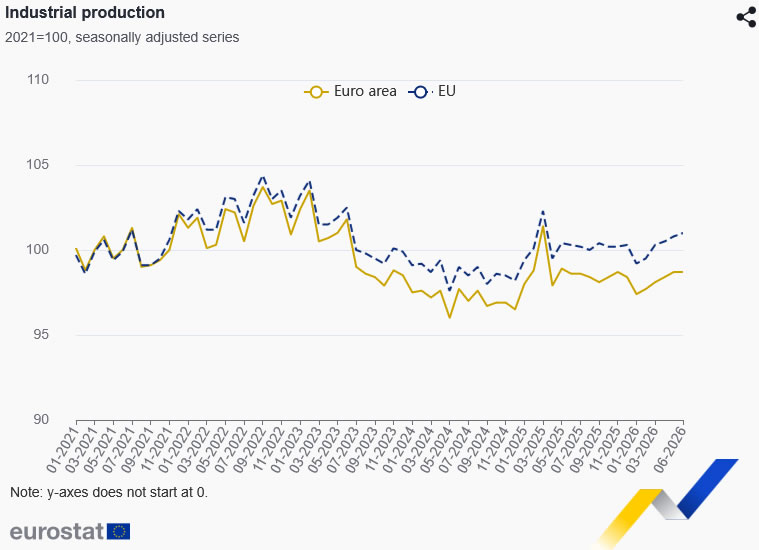
Eurozone industrial production lost momentum in June, slowing from 0.3% to 0.0% m/m, while EU output eased from 0.3% to 0.2%. On annual basis, production was only 0.1% higher y/y in Eurozone and 0.6% higher in EU, underscoring that industrial recovery remains subdued despite recent improvement in survey indicators. Headline Eurozone reading also fell slightly short of expectations for a 0.1% monthly increase.
Breakdown showed considerable divergence across sectors. In Eurozone, intermediate goods fell -0.8% m/m and capital goods dropped -1.4%, offsetting gains of 1.5% in energy, 0.3% in durable consumer goods and a strong 3.0% rise in non-durable consumer goods. EU showed similar pattern, with intermediate goods down -0.7% and capital goods down -0.9%, while energy rose 1.0%, durable consumer goods 0.9% and non-durables 2.5%. At country level, Denmark led gains at 5.4%, followed by Croatia at 5.2%, while Luxembourg posted a sharp 10.7% decline.
Overall, June figures suggest Europe’s industrial sector is stabilizing rather than entering a convincing rebound. Weakness in capital and intermediate goods is particularly notable because it points to continued softness in investment- and production-chain demand, even as consumer-related categories performed better. That contrasts with stronger July PMI readings and suggests hard data are still lagging improvement in business surveys, leaving ECB with a mixed growth backdrop rather than clear evidence of either renewed industrial weakness or broad-based acceleration.
Data Summary
| Indicator | Actual | Expected | Previous |
|---|---|---|---|
| Eurozone Industrial Production m/m | 0.0% | 0.1% | 0.3% |
| Eurozone Intermediate Goods m/m | -0.8% | — | -0.2% |
| Eurozone Energy m/m | 1.5% | — | 2.6% |
| Eurozone Capital Goods m/m | -1.4% | — | 0.5% |
| Eurozone Durable Consumer Goods m/m | 0.3% | — | -1.3% |
| Eurozone Non-Durable Consumer Goods m/m | 3.0% | — | 3.3% |
Key Takeaways
- Eurozone industrial production slowed from 0.3% to 0.0% m/m in June, slightly missing expectations for 0.1% growth.
- EU production also lost momentum, easing from 0.3% to 0.2% m/m.
- Annual growth remained weak, at just 0.1% in Eurozone and 0.6% across EU.
- Eurozone breakdown was uneven: capital goods fell -1.4% and intermediate goods dropped -0.8%, while energy rose 1.5%.
- Non-durable consumer goods were strongest category, rising 3.0% m/m, while durable consumer goods gained 0.3%.
- June data suggest industry is stabilizing rather than entering a convincing recovery, with hard production data still lagging recent improvement in Eurozone PMI surveys.
UK GDP Beats June Forecast with 0.4% M/M Growth as Services Keep Economy Moving
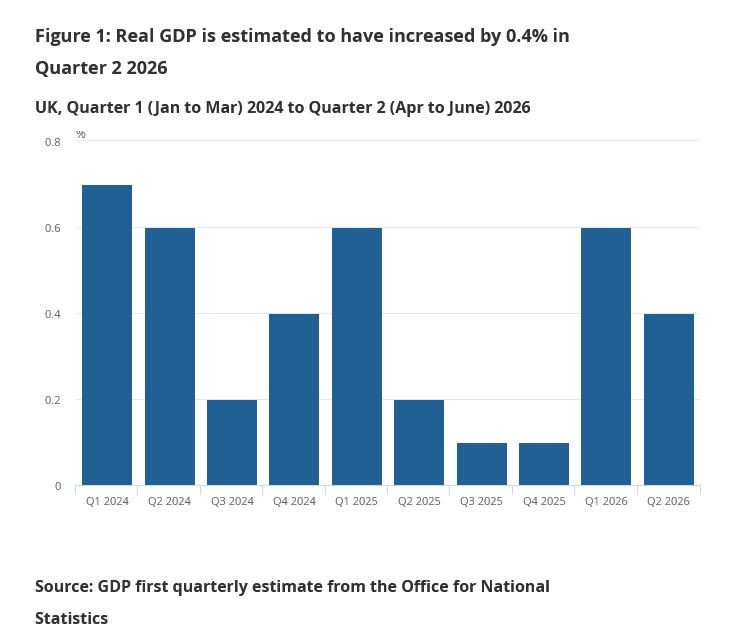
UK growth slowed in Q2, but economy finished quarter considerably better than June forecasts had suggested. GDP expanded 0.4% q/q after 0.6% growth in Q1, matching expectations, while annual growth accelerated from 0.9% to 1.2%, beating 1.1% consensus. GDP per head also increased 0.4% q/q, leaving it 1.0% higher than a year earlier. Services remained engine of expansion, growing 0.5% q/q over quarter, alongside a 0.3% rise in construction, while production stagnated.
More encouraging signal came from June. GDP rebounded from 0.0% to 0.3% m/m, versus expectations for a 0.1% decline, reversing some concern that growth was fading sharply after strong start to year. But improvement was concentrated in services, which rose 0.4%, while production contracted -0.2% and construction slipped -0.1%. Manufacturing weakened further from a revised -0.2% to -0.5%, showing that stronger headline GDP still masks considerable divergence across economy.
Overall, the report shows UK economy lost some momentum from Q1 but avoided sharper slowdown feared into quarter-end. Stronger June growth suggests a firmer handoff into Q3, although dependence on services and continuing weakness in manufacturing argue against describing recovery as broad based. For BoE, resilience in headline activity gives policymakers somewhat more room to stay focused on inflation, but GDP data alone are unlikely to materially change near-term policy stance.
Q2 GDP Summary
| Indicator | Actual | Expected | Previous |
|---|---|---|---|
| GDP q/q Q2 | 0.4% | 0.4% | 0.6% |
| GDP y/y Q2 | 1.2% | 1.1% | 0.9% |
| Services Output q/q Q2 | 0.5% | — | 0.8% |
| Production Output q/q Q2 | 0.0% | — | 0.2% |
| Construction Output q/q Q2 | 0.3% | — | — |
June GDP Summary
| Indicator | Actual | Expected | Previous |
|---|---|---|---|
| GDP q/q Q2 | 0.4% | 0.4% | 0.6% |
| GDP m/m Jun | 0.3% | -0.1% | 0.0% |
| Services Output m/m Jun | 0.4% | — | 0.1% |
| Production Output m/m Jun | -0.2% | 0.0% | -0.7% |
| Construction Output m/m Jun | -0.1% | — | -0.8% |
| Manufacturing Production m/m Jun | -0.5% | -0.3% | -0.2% |
Key Takeaways
- UK GDP slowed from 0.6% to 0.4% q/q in Q2, exactly matching expectations, while annual growth strengthened from 0.9% to 1.2%, beating 1.1% forecast.
- June GDP surprised clearly on upside, accelerating from 0.0% to 0.3% m/m against expectations for a -0.1% contraction.
- Services remained main growth engine, rising 0.5% q/q in Q2 and 0.4% m/m in June.
- Growth was uneven beneath headline, with production flat in Q2 and down -0.2% m/m in June, while manufacturing fell -0.5%.
- GDP per head rose 0.4% q/q and 1.0% y/y, adding a more constructive dimension to headline growth.
- Overall picture is of UK economy slowing rather than stalling, with stronger June activity providing a firmer handoff into Q3.
- For BoE, data modestly support patience by showing economy is holding up better than feared, though weak production prevents a broad-based growth signal.