
Crude Oil
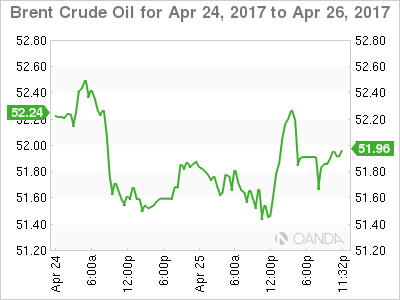
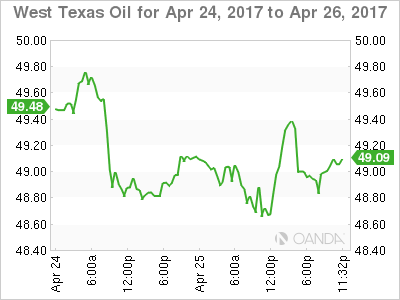
Choppy trading in decent ranges was the theme of the overnight session in crude, with both Brent and WTI showing good two-way interest after last week’s selloff. When the dust settled though, both contracts closed about 0.50 % higher for the day.
The API’s surprise increase in crude inventories and the Russian energy minister wanting more data before committing to a cut extension in June both saw crude under pressure. However, the effect was short-lived, implying that positioning is now much more balanced than it was last week. It gives credence to our theme that the sell-off was driven by excessive short-term speculative longs, rather than a previously unknown structural change in the market.
Both Brent spot and WTI spot remain mired at the bottom of their recent ranges, although the odds have now risen for a short term bounce. Tonight’s U.S. EIA Crude Inventories will now be the key to oils direction over the next 48 hours.
Brent spot has support at 51.20 and then 50.80 its 200-day moving average. Resistance lies at 52.50 initially.
WTI spot has support at 48.50, just under its 200-day average at 48.60, with resistance at 50.00.
Precious Metals
Gold
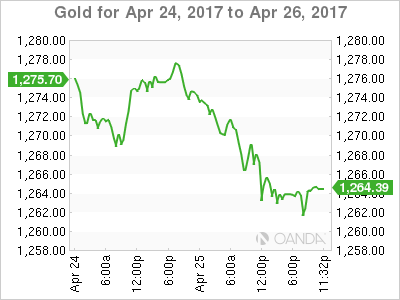
President Trump’s tax and economic plans seem to be finally getting some flesh on them, with some detail on corporate tax cuts and the dropping of border tax plans. With diminishing geopolitical tensions and a less itchy tariff finger, this was all adrenaline to the U.S. stock market and greenback, but a sugar crash for gold which fell 17 dollars in the session to 1261.
Extended safe haven long positioning has been the primary driver of gold’s rally above 1290 in recent times. But with repeated technical failures above that level and the world an apparently safer place the stage is being set for an apparent technical correction now.
Gold is trading at 1264 in early Asia, just above initial support at 1260. The 200-day moving average lies just below at 1254.35 with the significant longer term support at 1240. A break of the lower level suggests a much larger correction lower from a technical perspective.
Resistance sits at 1277 and 1280 initially, followed by the multi-day highs region around 1295.
Silver
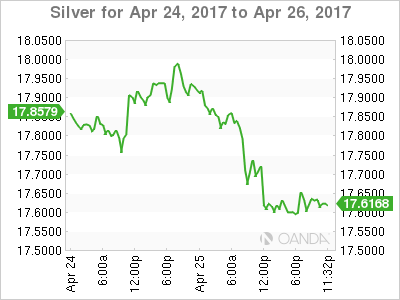
Silver failed at its 200-day moving average at 17.9800 yet again overnight, marking the 3rd failure in a row. In fact Silver had an outside reversal day yesterday, trading above Monday’s high before closing below Monday’s low, a bearish formation technically. The only bright spot being a hint of bullish divergence with the daily stochastic and RSI.
Silver trades at 17.6230 in early again just above the overnight low at 17.5620 which is now initial support. Behind this, the next support is the 100-day moving average at 17.3790 followed by the 17th March low at 17.2380.
Resistance lies at the 200-DMA at 17.9800, then yesterday’s high of 18.0120 and then the April high of 18.6550.
Summary
The charts suggest that the long positioning unwinds in crude oil has run its course for now ahead of tonight’s crude inventories. Conversely, the technicals suggest there could be more pain ahead for precious metals as a resurgent dollar and a quieter world undermine the price action in gold and more particulalry silver.


