Trump’s tax plans see the greenback strengthen and both oil and precious metal’s rallies fizzle out.
Crude Oil
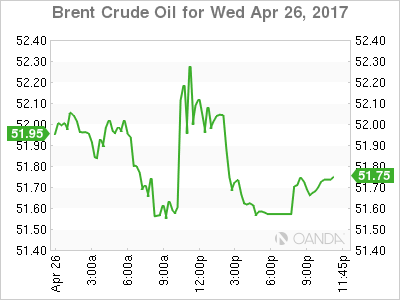
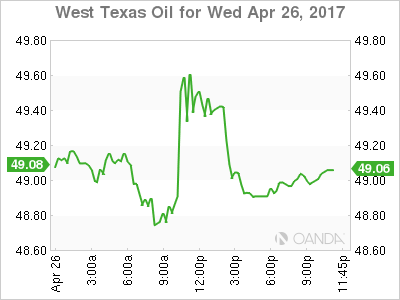
The turkey shoot that is the U.S. Crude Inventories produced another surprise overnight, with a drawdown of 3.6 million barrels against 1.75 million expected. This initially sent both Brent and WTI higher by over one dollar, with the spot levels failing just shy of 52.50 and 50.00 respectively.
The rally, however, was short-lived as traders noted that higher refinery demand had driven most of the drawdown and not end-user demand. Both contracts quickly fell back to close around 51.50 and 48.90 respectively on a spot basis.
For now, though, it is clear that the world has plenty of oil ‘in stock,’ making OPEC’s life that much harder ahead of its June production cut rollover date.
Brent
Brent spot opens slightly higher in Asia at 51.70 with resistance at 52.50 and support at 51.20.
WTI
WTI spot opens at 49.00 with support clearly denoted at 48.70, its 200-day moving average and then 48.50 close behind. Resistance lies at the key 50.00 region, which it has tested and failed near two times this week already.
Precious Metals
Gold
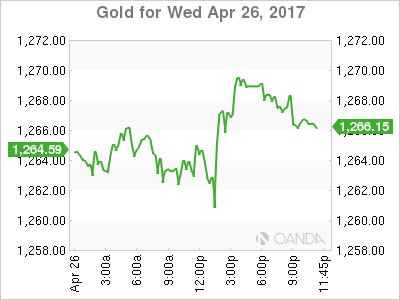
Gold continued its recent trend of lower daily highs overnight, failing at the 1270 level to trade in early Asia around 1266. With the U.S. dollar resurgent after President Trump’s tax announcements alongside equities, gold has struggled to make effective rallies as the previous week’s geopolitical tensions fade from traders’ minds.
From a technical perspective, gold still appears to be setting itself up for a meaningful correction lower with nearby support at 1254, the 200-day moving average, and then the key 1240 level. Gold has resistance at 1280 and then the 1296 area.
Intra-day, gold is locked in a 1260/1270 range with a break of either level probably seeing some stop-loss driven extension.
Silver
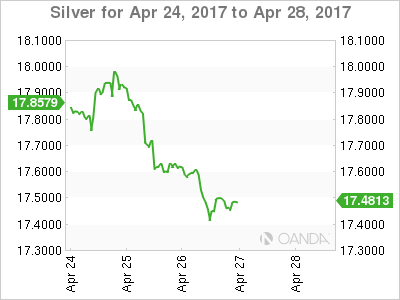
Following Tuesday’s bearish outside reversal day silver continues to tread water. Like gold, it attempted a rally back over 17.6000, but this soon fizzled out. Silver is trading in Asia around its New York close at 17.4290 with support at 17.3850, the 100-day moving average. Behind this is yesterday’s low at 17.3280 and then 17.2600.
Resistance lies at 17.6550 and then the 200-day moving average at 17.9660.
From a charting perspective, a daily close under the 100-dma would confirm the bearish outside reversal from Tuesday and imply that silver may see lower levels ahead.